Picture two people with identical bodies: 1.70 m tall, 69.4 kg, a body mass index of 24.0 (to one decimal place). In Brussels, the first walks out of a check-up with a "normal weight" reading — the WHO's international classification puts normal at 18.5–24.9. In Singapore, the second is told the same number sits in the moderate risk band, because the Health Promotion Board's risk-stratified thresholds flag everything from BMI 23.0 upwards.
The divergence isn't a contradiction. Nor is it, as many calculator sites claim, a case of Asia "using different official BMI categories". The real story comes from a single 2004 WHO Expert Consultation published in The Lancet. This guide covers the three main numbers from any health calculator — BMI, BMR, and TDEE. We'll show the equations and explain what the Asian asterisk means for readers in Singapore, Malaysia, and the wider region. Along the way we disclose something most calculator sites never mention about the activity multipliers they all use, including ours.
One thing before the numbers: this is an informational guide, not medical advice. Every figure below traces to a primary source — WHO, Singapore's HPB and MOH, Malaysia's MOH, or the peer-reviewed papers that defined the equations.
BMI: one division, decades of arguments
Body mass index is the simplest of the three: weight in kilograms divided by height in metres squared. The WHO defines adult overweight as a BMI of 25 or above and obesity as 30 or above; the full international classification has been stable for decades:
| BMI (kg/m²) | WHO international classification |
|---|---|
| Below 18.5 | Underweight |
| 18.5–24.9 | Normal weight |
| 25.0–29.9 | Overweight (pre-obese) |
| 30.0 and above | Obese |
The WHO is candid that BMI is a surrogate marker of fatness, not a direct measurement of it. The current fact sheet recommends supplementing it with measures such as waist circumference when diagnosing obesity. Keep that in mind for the whole of this guide — BMI is a screening number, not a verdict.
The Asian asterisk: what the 2004 consultation actually said
In January 2004, a WHO Expert Consultation published its findings on appropriate BMI for Asian populations in The Lancet. The evidence in front of it was that a substantial proportion of people in Asian populations face high risk of type 2 diabetes and cardiovascular disease at BMIs below the existing WHO overweight threshold of 25 — Asian populations show different relationships between BMI, body-fat percentage and health risk than European populations do.
What the consultation did with that evidence is where most secondary sources get sloppy. It kept the WHO BMI cut-off points, in its own words, "retained as international classifications". It did not create separate Asian categories. Instead, it identified additional public-health action points along the BMI continuum: 23.0, 27.5, 32.5 and 37.5 kg/m² — points where risk in Asian populations warrants attention even though the international classification is unchanged. The consultation was also honest about heterogeneity: the BMI at which observed risk rises varies from 22 to 25 across different Asian populations, and the high-risk point varies from 26 to 31. "Asian" is not one body type.
A BMI of 24 is classified "normal weight" by WHO everywhere. In Asian populations, however, the 2004 consultation's evidence showed health risk climbing from around 23, a finding that regional health authorities turned into policy.
What Singapore and Malaysia adopted
Singapore's Health Promotion Board and Ministry of Health, in their Clinical Practice Guidelines on obesity (CPG Obesity 1/2016), adopted risk-stratified bands built on those action points: 18.5–22.9 low risk, 23.0–27.4 moderate risk, 27.5 and above high risk. Malaysia's Ministry of Health took the same route — its Clinical Practice Guidelines on Management of Obesity, first issued in 2004 and updated in a second edition in 2023, classify normal as 18.5–22.9, overweight as 23.0–27.4 and obese as 27.5 and above, with obesity classes I to III beyond that. Here is how the two frameworks line up:
| BMI (kg/m²) | WHO international | Singapore HPB risk band |
|---|---|---|
| Below 18.5 | Underweight | Underweight |
| 18.5–22.9 | Normal | Low risk |
| 23.0–24.9 | Normal | Moderate risk |
| 25.0–27.4 | Overweight | Moderate risk |
| 27.5–29.9 | Overweight | High risk |
| 30.0 and above | Obese | High risk |
- BMI
- 24.0
- WHO band
- Normal
- Regional action point
- Moderate risk (23.0 action point)
The same height and weight read against both scales at once. The regional figures are risk action points, not a rival obesity class.
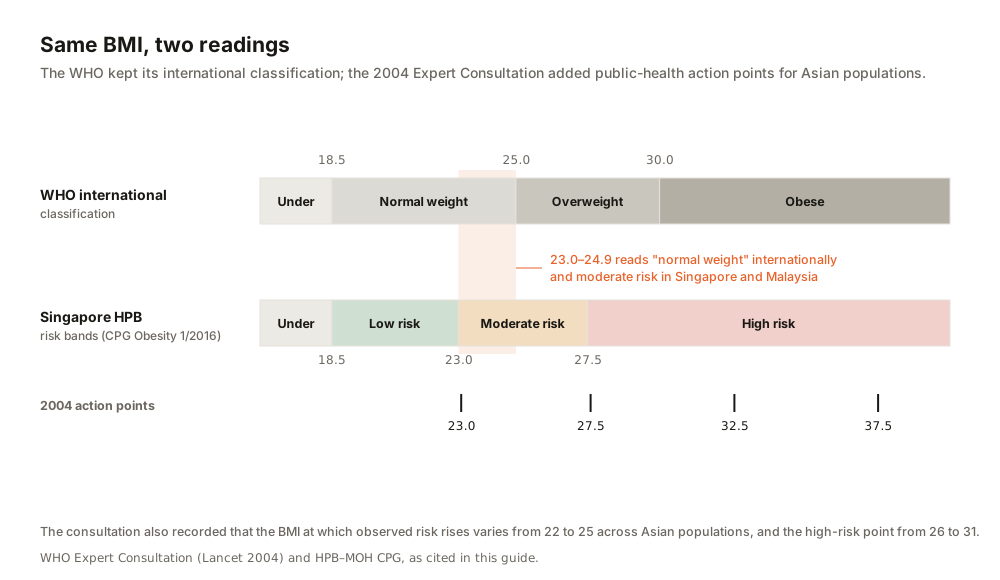
The 23.0–24.9 rows are the whole story of our two hypothetical people: internationally "normal", regionally flagged. The WHO South-East Asia Region estimates roughly one in five adults is overweight even by the international definition — and the action points exist precisely because risk in Asian populations starts climbing before that line.
Where BMI misleads everyone, everywhere
Because BMI cannot tell fat from muscle, bone or water, it misreads certain bodies regardless of region. A muscular athlete can post an "overweight" BMI while carrying little fat — WHO does not publish an athlete-specific exemption, but it follows directly from BMI being a fatness surrogate. Children and adolescents aged 5–19 should never be measured against adult cut-offs at all: WHO uses BMI-for-age against its Growth Reference, where overweight is more than one standard deviation above the median and obesity more than two. The number is also unreliable during pregnancy, at advanced ages, or with fluid retention. A BMI calculator tells people in these groups very little.
BMR: the equation under every calorie calculator
Basal (or resting) metabolic rate estimates the energy your body burns at complete rest. You cannot measure it with a formula — laboratories use indirect calorimetry — but two regression equations, built from calorimetry studies, dominate every calculator on the internet:
The research points to one equation. A 2005 systematic review by Frankenfield, Roth-Yousey, and Compher (published by what is now the Academy of Nutrition and Dietetics) found Mifflin–St Jeor the most reliable predictive equation. It predicted measured resting metabolic rate within 10% for more people — roughly 82% of non-obese and 70% of obese individuals — and had the narrowest error range. That is why our calculators, like most serious ones, use Mifflin–St Jeor. Note the error bars, though: even the best equation misses by more than 10% for around one person in five.
TDEE and the activity ladder nobody can source
Total daily energy expenditure scales BMR up to a real life: TDEE = BMR × an activity multiplier. Almost every calculator on the internet — including ours — offers the same five-rung ladder: sedentary 1.2, lightly active 1.375, moderately active 1.55, very active 1.725, extremely active 1.9.
The 1.2–1.9 activity ladder used by most calculators, including ours, has no clean primary source. When we traced it for this guide, no WHO, FAO or government publication defines those exact five values. The actual international standard is the FAO/WHO/UNU Physical Activity Level (PAL) framework from the 2001 expert consultation on human energy requirements (report published 2004), and its numbers are different: sedentary or light lifestyles 1.40–1.69, active or moderately active 1.70–1.99, vigorously active 2.00–2.40 — a continuum applied as BMR × PAL. The familiar ladder is a practitioner convention from dietetics and exercise-physiology practice: useful, widely reproduced, but not a standard. Our own TDEE and calorie calculators use the familiar ladder too, because it is what users expect and compare against — this guide is where we put its pedigree on record: the authoritative reference runs 1.40–2.40.
| Lifestyle | Popular calculator ladder | FAO/WHO/UNU PAL (2001) |
|---|---|---|
| Sedentary / light activity | 1.2 – 1.375 | 1.40 – 1.69 |
| Active / moderately active | 1.55 – 1.725 | 1.70 – 1.99 |
| Vigorously active | 1.9 | 2.00 – 2.40 |
Two calculators giving different TDEEs are probably both "right" by their own conventions. Treat any TDEE as an estimate with a real margin, and adjust it against what the scale does over a few weeks.
Putting the three numbers together
Used with their limitations in mind, the three numbers form a sequence. BMI, read against your region's bands, suggests whether weight change is worth considering. BMR estimates your resting burn, and TDEE estimates your maintenance intake — the level at which weight holds roughly steady.
From maintenance, the mainstream public-health guidance on rate of change is consistent across bodies. The US CDC advises that people who lose weight gradually and steadily — about 1 to 2 pounds (roughly 0.5–1 kg) a week — are more likely to keep it off. The UK NHS gives the same 0.5–1 kg per week range, built on a modest daily calorie deficit. In deficit terms, that corresponds to roughly 500–1,000 kcal below maintenance per day — guidance from those bodies, not a precise physiological law; the old "3,500 kcal equals one pound" rule is an approximation. Steeper sustained deficits sit outside what either body recommends attempting on your own, and anyone with a medical condition, a history of disordered eating, or significant weight to lose should be working with a professional rather than a calculator.
The hands-on layer: what our calculators actually do
RECATOOLS' health calculators implement the framework in this guide. Where the evidence has an asterisk, this guide explains it.
The BMI calculator uses the Asian thresholds throughout: normal 18.5–22.9, overweight 23.0–27.4, obese 27.5 and above, labelled in-tool as the WHO WPRO 2000 Asian thresholds recommended by Singapore's Health Promotion Board. It deliberately does not classify against the international 25/30 bands, showing them only as a side-by-side comparison — it is built for the region it serves, and its ideal-weight range is computed from the 18.5–22.9 band. The TDEE calculator computes BMR with Mifflin–St Jeor, applies the conventional 1.2–1.9 activity ladder (with the caveat above), and offers goal presets: a 500 kcal deficit for losing at about 0.5 kg a week, maintenance, or a 300 kcal surplus for gaining, plus a macro split. The calorie calculator runs the same Mifflin–St Jeor engine and multipliers in a simpler daily-calories view, and hands off to the TDEE tool for macros. All three are simplified aids for healthy adults — screening and planning inputs, not assessments.
FAQ
Is a BMI of 24 healthy or not?
By the WHO international classification, 18.5–24.9 is normal weight, so 24 is within that band. Under Singapore's HPB risk bands and Malaysia's MOH guidelines, however, 24 falls in the 23.0–27.4 moderate-risk band. If the reading concerns you, a doctor can assess factors BMI doesn't measure, like waist circumference and body composition.
Which BMR equation should I trust?
Mifflin–St Jeor (1990) is the best-supported choice: the 2005 Frankenfield systematic review found it predicted measured resting metabolic rate within 10% more often than any other equation. Harris–Benedict (1918, revised by Roza and Shizgal in 1984) remains a common alternative and typically produces slightly different numbers.
Why do different calculators give me different TDEEs?
Usually because of the activity multiplier, not the BMR equation. The popular 1.2–1.9 ladder is a convention with no primary source, and sites implement activity levels differently; the authoritative FAO/WHO/UNU PAL ranges run 1.40–2.40. Any TDEE is an estimate — calibrate it against a few weeks of real-world results.
Do these numbers work for children or during pregnancy?
No. For ages 5–19, WHO uses BMI-for-age against its Growth Reference — adult cut-offs do not apply. In pregnancy, weight gain is expected and BMI cut-offs are not designed for it. Both situations belong with a healthcare professional, not a calculator.
This guide is informational only and is not medical advice, a diagnosis, or a substitute for professional care. Decisions about your diet, weight or health should be made with a qualified doctor or dietitian, especially if you have any medical condition.
- Obesity and overweight fact sheet (updated 8 Dec 2025) — World Health Organization (accessed 21 Jul 2026)
- WHO Expert Consultation: Appropriate body-mass index for Asian populations — The Lancet, 2004;363(9403):157–163 (PubMed) (accessed 21 Jul 2026)
- Weight management — HealthHub, Health Promotion Board Singapore (accessed 21 Jul 2026); risk bands per HPB–MOH Clinical Practice Guidelines, Obesity 1/2016
- Clinical Practice Guidelines: Management of Obesity, 2nd ed. 2023 — Malaysia MOH / Malaysian Endocrine & Metabolic Society (accessed 21 Jul 2026)
- Mifflin MD, St Jeor ST, et al.: A new predictive equation for resting energy expenditure — Am J Clin Nutr, 1990;51(2):241–247 (PubMed) (accessed 21 Jul 2026)
- Harris JA, Benedict FG: A Biometric Study of Basal Metabolism in Man — Proc Natl Acad Sci USA, 1918;4(12):370–373 (accessed 21 Jul 2026)
- Roza AM, Shizgal HM: The Harris Benedict equation reevaluated — Am J Clin Nutr, 1984;40(1):168–182 (PubMed) (accessed 21 Jul 2026)
- Frankenfield D, Roth-Yousey L, Compher C: Comparison of predictive equations for resting metabolic rate — J Am Diet Assoc, 2005;105(5):775–789 (accessed 21 Jul 2026)
- Human Energy Requirements: Report of a Joint FAO/WHO/UNU Expert Consultation, Rome 2001 (published 2004) — FAO (accessed 21 Jul 2026)
- Steps for Losing Weight — US Centers for Disease Control and Prevention (accessed 21 Jul 2026)
- Healthy weight — NHS (UK) (accessed 21 Jul 2026)
- Obesity — WHO South-East Asia Region (accessed 21 Jul 2026)

View author profile → · Editorial policy