You take a personality test, get a four-part label, and it feels like a description of you. Take the same test again a year later and the label has moved. The usual explanation is that you changed.
Sometimes you did. But a great deal of that movement has nothing to do with you, and you can prove it without any psychology at all — just by looking at where the lines are drawn.
The label is a threshold; the measurement is the score
Take our own attachment test. It scores two things: how much anxiety you carry about closeness, and how much avoidance. Each runs from 8 to 40.
The label comes from one comparison. Each axis is checked against a midpoint of 24, and the four possible above-or-below combinations give the four styles. That is the whole mechanism.
So the interesting question is not your score, but how far it sits from 24.
We counted the whole board
The score space is small enough to test exhaustively. So we did, running all 1,089 possible score combinations through the test's own engine.
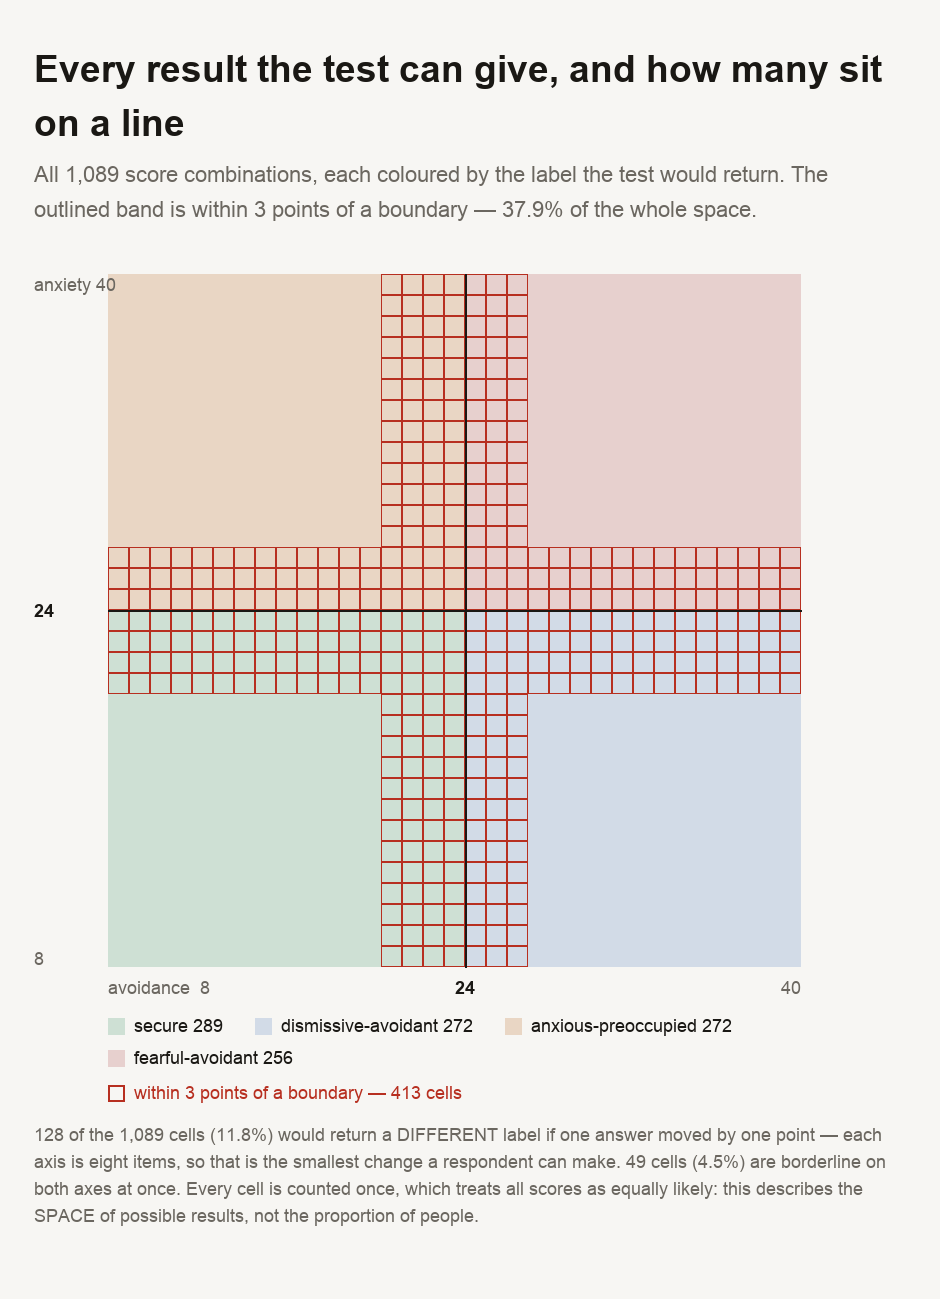
413 of those 1,089 combinations — 37.9 per cent, or more than a third of all possible results — sit within three points of a boundary on at least one axis.
The number that explains the retake
So how many results would flip to a different label if a single answer changed by just one point?
128 combinations. 11.8 per cent.
Each axis is eight statements, so one statement answered "slightly agree" instead of "agree" moves that axis by one. For about one result in eight, that is enough to change what the test calls you.
Forget a bad night's sleep or a year of growth. The cause can be as small as one answer changing by one point.
This is not a fault in the test
To be clear, this is not a criticism of the underlying scores. It is easy to draw the wrong conclusion here.
The underlying scores are measuring something. Anxiety and avoidance about closeness are among the better-supported constructs in this area, and a score of 34 means something different from a score of 12. Nothing above touches that.
The fragile part is the last step: turning two continuous numbers into one of four names. Any threshold does this. Draw a line anywhere through a continuum and the people nearest the line will cross it for trivial reasons, and there is no cleverer place to put the line that avoids the problem.
Our own test already flags this: it tells you when a score is within three points of the boundary, and that band is where the 37.9 per cent figure comes from. That warning is the honest part of the design, and it is the part people skip.
How to read one of these properly
The numbers are the substance of the result; the name is only a label. "Anxiety 25, avoidance 23" and "anxiety 23, avoidance 25" are nearly the same person and carry different labels; the numbers say so and the label hides it.
A borderline result provides useful information: it means the test could not distinguish you from the neighbouring category.
And if a retake moves you, check whether either score moved much before concluding anything about yourself. A label that flipped while both numbers barely moved is a fact about the boundary, not about you.
A four-part label is just two numbers passed through a threshold. More than a third of all possible results lie within three points of a boundary, and for 11.8 per cent of all outcomes, a one-point shift in a single answer is enough to change the name. That is the likeliest reason a retake "changed" you. For this reason, trust the scores over the label. A borderline flag means the instrument could not tell you and the next category apart. The underlying measurements are still useful — anxiety and avoidance are measuring something, and a 34 is different from a 12 — but the last step from numbers to names is fragile. Any test that sorts people into categories faces this same problem.
Seeing it on your own result
Our attachment style test reports both axis scores alongside the label and flags a borderline result, so you can check your own distance from the line. The Big Five test is the case where this problem largely does not arise, because it reports five continuous scores and never converts them into a type. To understand the models themselves, see what the two attachment axes measure, how the Big Five trait approach works, and why the Enneagram raises the same boundary question.
- Every figure is computed by a script committed alongside this guide, using
personality-kernel.js— the module our own attachment test runs on — so the thresholds and labels here cannot drift from the tool. - The entire score space was walked exhaustively rather than sampled: all 1,089 combinations of the two axis scores. These are counts, not estimates.
- ⚠️ EVERY SCORE PAIR IS COUNTED ONCE, which treats them as equally likely. Real respondents are not distributed uniformly, so these shares describe the SPACE of possible results and must not be read as the proportion of PEOPLE who are borderline. That number would require response data, which this does not use.
- ⚠️ NO RESPONSE DATA WAS READ AND NO USER IS INVOLVED. This is a property of the scoring geometry, computed from the thresholds alone.
- ⚠️ THE BORDERLINE BAND IS THE ONE THE PAGE ALREADY SHIPS, three points either side, read from the kernel rather than chosen for this guide. It is documented there as a copy trigger rather than a score.
- ⚠️ THIS IS NOT A CRITICISM OF THE UNDERLYING MEASUREMENT. Anxiety and avoidance are measuring something real, and the guide's argument is about the final step from continuous scores to discrete names — a property of every categorical instrument, not a defect unique to this one.
- ⚠️ ONE-POINT MOVEMENT IS TREATED AS ONE ANSWER SHIFTING BY ONE, which follows from eight items per axis. It is not a claim about how much real respondents' answers vary between sittings, which would need test-retest data this guide does not have.
This article describes the arithmetic of how a personality test converts scores to labels. It is not psychological or clinical advice, an assessment of any test's validity, or a substitute for speaking to a qualified professional about anything it raises for you.

View author profile → · Editorial policy