The complaint is always the same shape. Pages are slow, the video buffers, and the Wi-Fi symbol is right there at the top of the screen with every bar filled in. So the Wi-Fi gets the blame, and the next hour goes into moving the router, changing a channel, or buying a faster one.
That hour is usually wasted, and we can show you why rather than assert it. A page load is not one event. It is a sequence of separate stages, each of which can be timed on its own, and the radio in your laptop is only involved in one of them. Time the stages and the culprit stops being a matter of opinion.
Start with the link, not the router
Start with the link rate, the one number people never check. The machine used for these measurements reports an 802.11ax connection on channel 40 in the 5 GHz band, with a -51 dBm signal and a negotiated transmit rate of 206 Mbps.
That is a strong signal and a modern standard. It is also nothing like the number on the router's box. The reason sits in the same line of stats: the channel is only 20 MHz wide. Channel width has more impact on Wi-Fi throughput than almost anything else, and the big numbers on the box assume 80 or 160 MHz. On a 20 MHz channel, 802.11ax negotiates a fraction of what the standard is capable of, regardless of how new the hardware is.
So this is a link on a channel a quarter the width that headline figures assume — exactly the situation someone would set out to fix. Hold that thought, because 206 Mbps turns out to be far more than anything on this page needs.
Five stages, and the radio is one of them
A request breaks down into five stages: finding the server's address, opening a connection, agreeing on encryption, waiting for the server, and finally receiving the bytes. Only the last of those involves moving your page across the air. The rest is your device and the server taking turns to speak, and each turn has to cross the whole internet and come back.
Three sites, five samples each, medians:
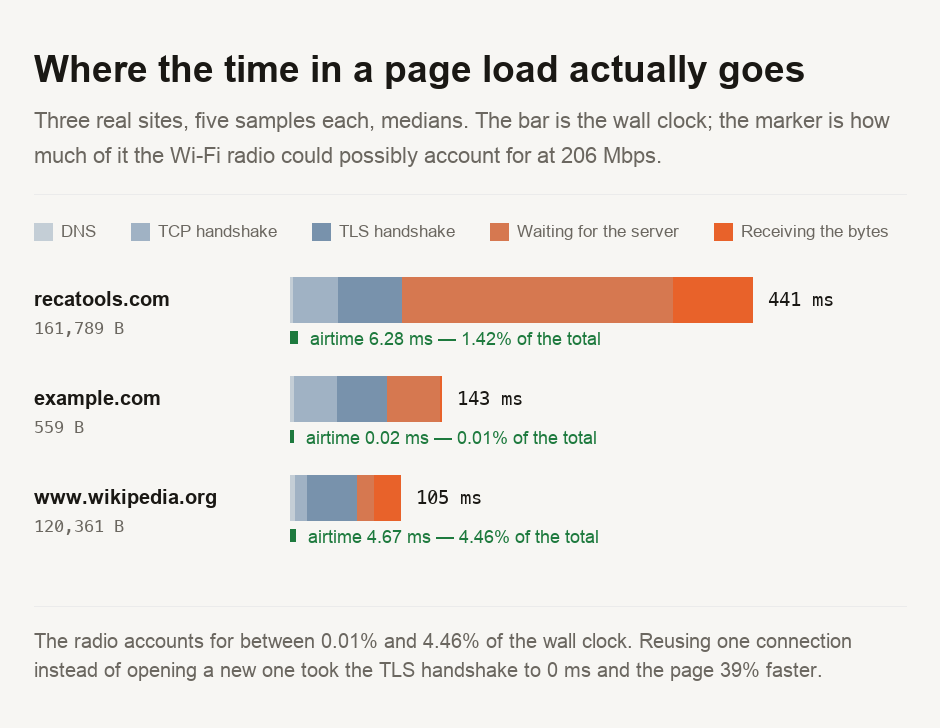
The arithmetic behind that green marker is the whole argument. Our own home page is 161,789 bytes. At 206 Mbps, moving that many bytes takes 6.28 milliseconds. The page took 441 milliseconds. The radio accounts for 1.42 per cent of the time you spent waiting.
The extreme case makes it plainer. example.com is a single page of 559 bytes — a short paragraph of text. It took 143 milliseconds, of which the airtime was 0.02 milliseconds. Almost the entire wait was three round trips: finding the address, opening the connection, and negotiating encryption. Doubling the Wi-Fi speed would have removed one hundredth of a millisecond.
Across all three sites the radio accounted for between 0.01 and 4.46 per cent of the wall clock. There is no realistic Wi-Fi upgrade that turns 4 per cent into a noticeable improvement.
The stage that does respond
One measurement in this set behaves completely differently from the rest. Requesting the same page five times over a single reused connection, instead of opening a new one each time, took the TLS handshake from 123 milliseconds to 0 — and the total from 455 milliseconds to 277. A 39 per cent saving, from doing nothing except not starting over.
This is why a site feels sluggish on the first page and fine on the second, and why the first page after a long idle feels slow again. It is the mechanism behind most speed advice that actually works. The handshakes are the expensive part, and avoiding them helps far more than moving bytes faster.
Which leaves an uncomfortable number of our own
Look again at that chart and one bar is embarrassing, and it is ours.
The stage marked "waiting for the server" is the time after the connection is fully established and before a single byte of the page comes back. It is pure server think-time — the network has already done its work. Wikipedia's was 15.9 milliseconds. Ours was 259.2 milliseconds, roughly sixteen times longer, on a page that is only about a third larger than theirs.
Not the Wi-Fi. Not the reader's router. Our server, thinking, while the reader waits — and it is over half of the 441 milliseconds a first-time visitor spends on our home page. We are recording it here rather than quietly fixing it first, because a guide arguing that people misattribute slowness would be a poor place to hide an example of exactly that.
What we have not done is diagnose it. Distance to the server, database queries, cache misses and page rendering all live inside that one number, and separating them needs instrumentation on the server rather than a stopwatch outside it. Naming the stage is honest; naming a cause we have not measured would not be.
When it genuinely is the Wi-Fi
This is not to say the radio never matters, only that it rarely matters for browsing.
Sustained transfers are the main test. A large download or a video stream runs for long enough that the link rate stops being a rounding error and becomes the constraint — that is the case where 20 MHz versus 80 MHz shows up as a number you can feel. A weak signal is the other case: as signal drops the link renegotiates downward, and a rate that has fallen to single-digit megabits will slow a page load, because at that point the airtime is no longer 1 per cent of anything.
The distinguishing symptom is simple. Wi-Fi problems get worse as you move away from the router and better as you approach it. Handshake and server problems do not care where you are standing. Before rearranging any furniture, walk to the router and reload — if nothing changes, the furniture was never the issue.
A page load is mostly round trips, not transfer. At the 206 Mbps this link negotiated, the bytes of a real page crossed the air in about 6 milliseconds out of 441 — between 0.01 and 4.46 per cent of the wait across three sites. What did respond was reuse: skipping a repeat TLS handshake cut the same page by 39 per cent. So a faster router will not fix a slow-feeling web, because the radio was never the part you were waiting for. It becomes the constraint in two situations — sustained transfers, and a signal weak enough to collapse the link rate — and both have a tell: they change when you walk towards the router.
Two numbers your own machine will tell you
Your operating system will show you your own link rate and channel width — on macOS, hold Option and click the Wi-Fi icon; on Windows, run netsh wlan show interfaces. Those two numbers tell you whether your radio has any headroom left, and comparing them against page size is the arithmetic above. Our data storage converter handles the byte-to-bit conversion that trips everyone up, since a link rate is quoted in bits and a page is measured in bytes, a factor of eight that swallows arguments.
For the stages before the transfer, DNS lookup shows what the first stage has to resolve and how many hops it takes to get there, and our guide on encrypted DNS covers what that lookup discloses along the way. If you are trying to work out which addresses belong to your own network rather than the wider internet, the subnet calculator does that arithmetic, and IP lookup shows how far away the server you are complaining about actually is.
- Every timing here comes from a script committed alongside this guide, which requests each site five times and records the five stages separately. Medians, not means — one sample stalled at 1,444 milliseconds against a 441 millisecond median for the same page, and a mean would have carried that stall into the conclusion.
- The link rate, channel, channel width and signal strength are what the machine's own wireless interface reported at the time of the test, not a specification figure. Airtime is computed from that reported rate, which makes it a lower bound on how long the transfer took and therefore an upper bound on how much the radio could be blamed for.
- ⚠️ This is one machine on one home network in Singapore, on a good signal. The proportions will differ on a congested network, at distance, or on a connection to a server on another continent. The mechanism does not change — round trips dominate small transfers — but the specific percentages are ours.
- ⚠️ The 259 millisecond server-wait figure for our own site is a measurement, not a diagnosis. It contains network distance to the server as well as the server's own work, and we have not separated them. We are reporting the stage, not its cause.
Wi-Fi performance depends on hardware, distance, interference and how many neighbours share your channel — none of which this page can measure for you. What it can show you is which stage of a page load is eating your time — the first step in deciding whether your hardware is worth investigating at all.

View author profile → · Editorial policy