
The upgrade conversation always runs the same way. Someone works out that four people streaming at once needs four times one person's requirement, arrives at a number, and buys the plan above it.
That arithmetic assumes a connection gets divided. We measured what actually happens, and it does not.
What we did
The same 5 MB transfer, started one, two, four and eight times simultaneously, three repeats each, medians. Each stream's throughput is its own bytes over its own seconds; the total is what the link handed to all of them at once.
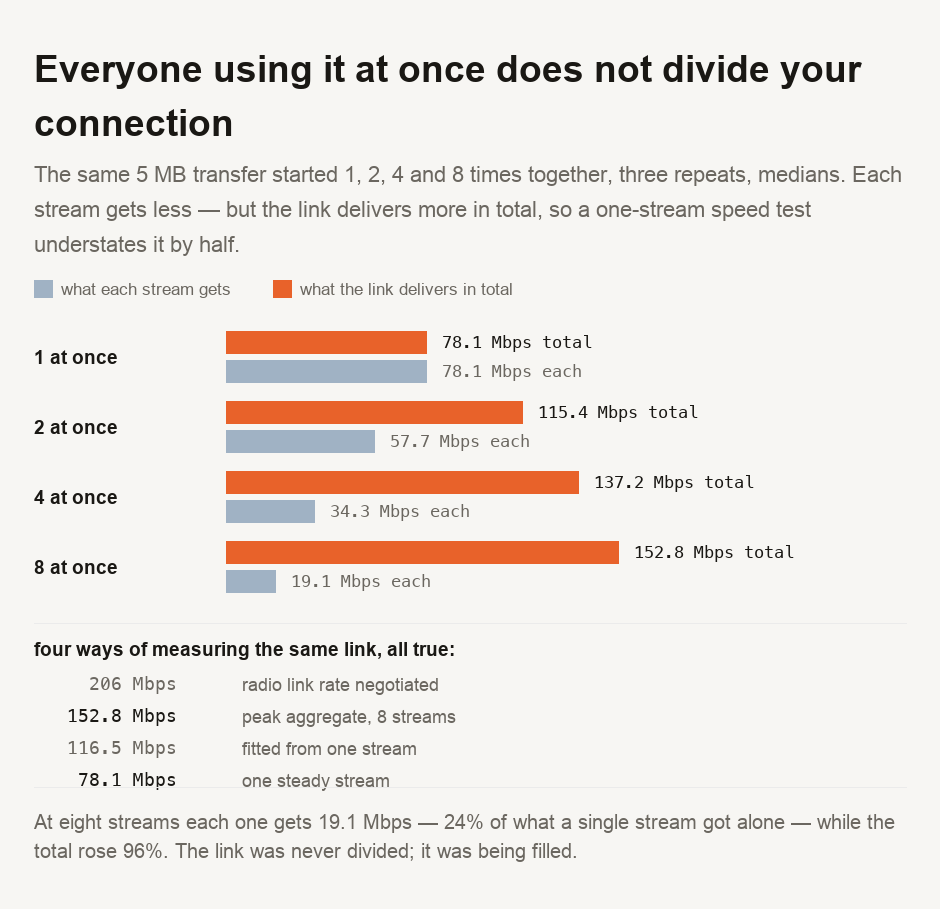
One stream on its own reached 78.1 Mbps. Eight streams together reached 152.8 Mbps between them — 96 per cent more than the single stream managed alone.
The link, then, had no fixed capacity waiting to be shared out; one transfer simply could not fill it.
Which breaks the arithmetic in both directions
Each individual stream did get slower. At eight at once, each received 19.1 Mbps — 24 per cent of what one stream got by itself. If you are one of the eight, your download is four times slower.
But the household total went up, not down. Four people streaming are not each getting a quarter of your plan; they are collectively extracting more from it than any one of them could alone.
That matters for the buying decision, because the usual method — take one person's needs, multiply by the number of people — is measuring the wrong thing. The right question is not about the total, but whether each stream still gets enough to meet its minimum.
Your speed test is not measuring your connection
This is where the usual speed test misleads you. A single-stream test on this link reports 78.1 Mbps. The same link delivered 152.8 Mbps when asked properly.
A test that opens one connection is measuring one connection, and one connection ramps up, waits on acknowledgements and shares a path — none of which is the link's limit. Most consumer speed tests open several streams for this reason, so be sceptical if a single-stream tool claims your plan is underdelivering.
Four numbers for one link, all of them true
This is the third time we have measured this connection, and each method gave a different answer. Setting them side by side is more useful than picking one.
The radio negotiated a link rate of 206 Mbps. Eight concurrent transfers extracted 152.8. Fitting a line across payload sizes gave 116.5. One steady stream managed 78.1.
None of those is wrong; the lesson is in the spread. A single number describing a connection always omits the conditions that produced it. If your plan, a speed test and your own experience disagree, it is usually because they are measuring different things, not because one is lying.
So what do you need?
We are not going to give you a number in megabits, because the honest answer depends on what you do and no article can know that. What we can give you is a way to stop guessing.
Start from the activities that have a real floor. Video calls and live streams break when throughput drops below their requirement, and no amount of total capacity helps if the per-stream share falls under it — that is the failure mode our measurement produced at eight concurrent transfers. Everything else, including large downloads, is elastic: it simply takes longer.
Then test under the conditions you actually care about. Run several transfers at once rather than one, and watch whether the per-stream figure stays above what your worst-case activity needs. If it does, your plan is adequate however unimpressive the single-stream number looks. If it does not, you have found the real constraint — and it might be your own equipment rather than the plan, since we have previously measured a radio negotiating a link rate well below the plan behind it.
Do not multiply one person's needs by the number of people — a connection is filled, not divided. We measured one stream managing 78.1 Mbps while eight together extracted 152.8, so the household total rose 96 per cent even as each stream dropped to 24 per cent of its solo rate. What matters is whether the per-stream share stays above the floor for whatever breaks when starved, which is video calls and live streams rather than downloads. Test that directly by running several transfers at once, because a single-stream speed test measures one connection rather than your link, and on this one it understated the answer by half. And check your own equipment before your plan: the radio here negotiated 206 Mbps and nothing we did got near it.
Running this yourself
The script is committed with this guide and takes the concurrency levels as arguments. Our data storage converter handles the factor of eight between the bits a plan is sold in and the bytes a file is measured in, and shows how long a given transfer should take at each of a range of link rates. For which of the two quantities you are actually waiting on, latency against bandwidth separates them by measurement, and where a page load's time goes shows why the radio is rarely the answer.
- Every figure comes from a script committed alongside this guide: the same 5 MB payload requested 1, 2, 4 and 8 times simultaneously, three repeats, medians. Per-stream throughput is each transfer's own bytes over its own elapsed time; the aggregate is what the link delivered to all streams at once.
- The 206 Mbps radio link rate and the 116.5 Mbps fitted figure are quoted from our earlier measurements of this same connection rather than re-measured here. They are cross-checked against those guides' recorded figures so the three cannot drift apart.
- ⚠️ One machine, one network, one destination, on one afternoon. Concurrency behaviour depends heavily on the route and on what else is competing — the numbers are ours and the shape is what generalises.
- ⚠️ All eight streams went to the SAME host. Real household use spreads across many destinations, which can behave better or worse than this. We did not test multiple destinations, so the aggregate figure is a lower bound on what a varied workload might extract rather than a ceiling.
- ⚠️ We did not measure video calling or live streaming, which are named above as the activities with a hard floor. That claim is about how those protocols behave under starvation, not a measurement we performed, and the guide deliberately gives no megabit figure for them.
Network performance depends on your route, your equipment and what else is using the connection. The method here is reproducible on your own link; the numbers it produces will be yours rather than these.

View author profile → · Editorial policy