Internet plans are sold in one number. More megabits, more money, and the implication that the number is what makes things fast.
That number is half the story, and for most of what you do online it is the smaller half. The other half — latency — has no line on your bill, cannot be upgraded, and is usually what you are actually waiting for.
Two quantities that get given one name
Bandwidth is how much can move per second — the width of the pipe. Latency is how long it takes one thing to get there and back — the length of it. Widening a pipe does not shorten it.
Everyday advice collapses both into "speed", which is why doubling a plan so often changes nothing you can feel.
You can separate them with one host
A transfer's total time has two parts: a fixed cost for the round trip, plus a variable cost of bytes divided by rate. Asking one server for progressively larger payloads pulls those two into view. The fixed cost is whatever time remains as the size approaches zero; the slope after that reveals the bandwidth.
We asked the same host for six sizes, five times each, and took medians.
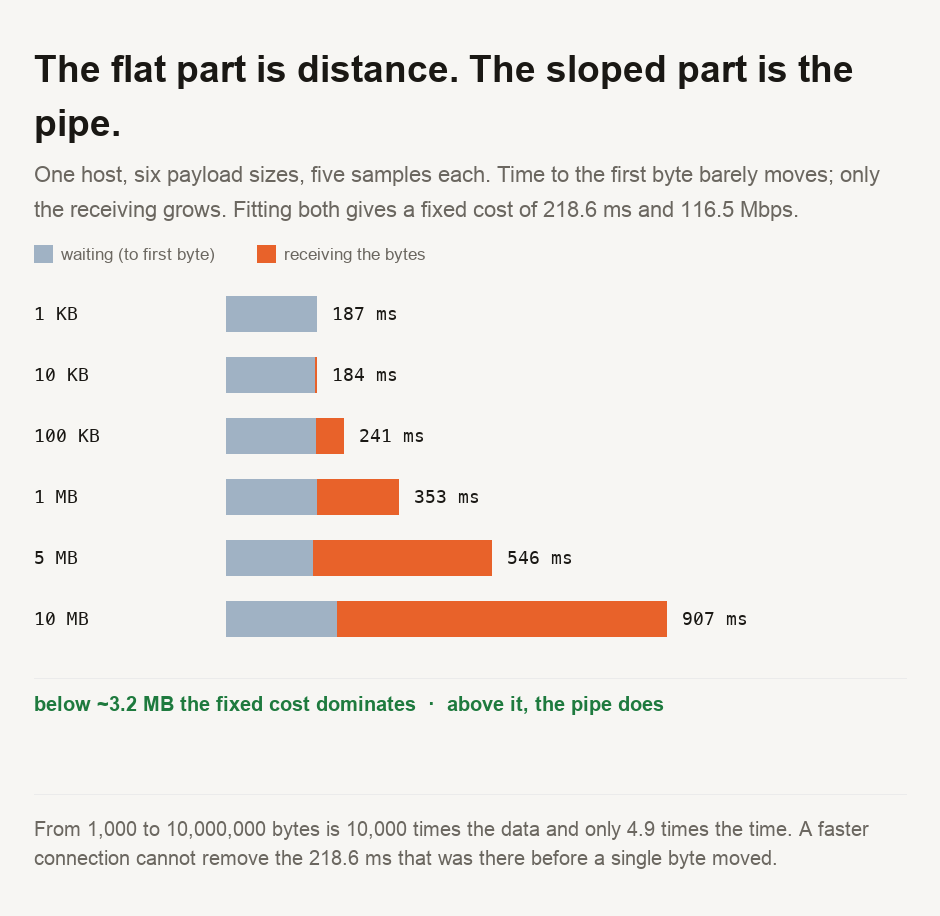
Look at the first two rows. 1,000 bytes took 186.6 ms. Ten times as much data took 184.5 ms — very slightly less, which is measurement noise rather than a real gain. At that size the payload is free; you are paying for the round trips and nothing else.
Now the whole range. Going from 1,000 to 10,000,000 bytes is 10,000 times the data for 4.9 times the time.
What the fit says
Fitting the line across all six sizes gives a fixed cost of 218.6 ms and a throughput of 116.5 Mbps.
We did not look up a plan speed or ping anything separately. Both the fixed cost and the throughput fell out of the same measurement: watching one link do the same job at different sizes.
The grey bars make the mechanism visible. Time to the first byte sits at a median of 185.7 ms whatever you ask for, because it is the connection being set up and a request crossing the distance. Only the orange grows.
The size where the answer flips
The fixed cost and the transfer cost are equal at about 3.2 MB. Below that, distance decides. Above it, the pipe does.
That threshold explains a lot of ordinary experience. A web page, a message, an API call or a form submission is far below it. These jobs are latency-bound, and completely indifferent to a faster plan. A film download or a photo backup sits well above it, and there the extra megabits are exactly what you are buying.
It also explains why a page can feel slow on a fast connection. A page is not one transfer; it is dozens, and each carries its own share of that fixed cost. Fifty small requests at a couple of hundred milliseconds each is a slow page on any plan, which is why our guide on where a page load's time goes found the radio accounting for barely one per cent of the wait.
What actually moves latency
Distance sets the floor, a limit imposed by physics rather than by your provider. Light in fibre covers roughly two-thirds of a metre per nanosecond, and the route is never a straight line. A server on another continent cannot answer quickly no matter what either of you is paying.
The rest is round trips. Every new connection costs a handshake, and an encrypted one costs another. This is why reusing a connection is worth so much more than widening it. We measured a repeat request to the same site finishing 39 per cent faster just from avoiding a new handshake.
So the levers that actually work are reducing distance and the number of round trips: servers nearer your users, fewer separate requests, and connection reuse. None of them appears on a broadband advertisement.
If your day is pages, messages and app screens, latency is what you are waiting for and more megabits will not help — we measured 10,000 times the data costing only 4.9 times the time, and the crossover where bandwidth starts to matter sat at 3.2 MB. If your day is large downloads, video or backups, the opposite holds and the plan speed is exactly the thing to buy. Test it before you upgrade: request something tiny and something large from the same place, and if the small one is not much faster, your bottleneck is distance and no plan fixes distance. For anything you build, reuse connections and make fewer requests before you think about size.
Measuring your own
The script is committed with this guide and points at any host that will serve a size you choose. Our data storage converter handles the bits-against-bytes conversion that makes plan speeds and file sizes hard to compare — a factor of eight that swallows arguments — and it also shows how long a given quantity takes to move at each of a range of link rates, so you can predict a transfer before starting it. If you want to see where a specific page's time goes rather than a single transfer's, where a page load's time goes breaks one apart by stage, and DNS lookup shows the first round trip of every connection you make.
- Every figure comes from a script committed alongside this guide: one host, six payload sizes, five samples each, medians. The fixed cost and the throughput are fitted by least squares over those medians, so both come out of the same measurement rather than either being assumed or looked up.
- Medians, not means. One stalled sample would move a fit noticeably, and the fit is the whole argument.
- ⚠️ One machine, one network, one destination, on one afternoon in Singapore. A different distance changes the fixed cost and a different link changes the slope — that is the point of the method rather than a flaw in it. The specific 218.6 ms and 116.5 Mbps are ours; the shape is general.
- ⚠️ The straight-line model is a simplification. Real transfers ramp up rather than starting at full rate, so the fit slightly understates throughput on small payloads and the crossover is an approximation rather than a threshold. It is accurate enough to answer the question the guide asks, and not accurate enough to quote to three decimal places.
- ⚠️ We did not test a second provider or a second continent, so nothing here compares one network against another. The 39 per cent connection-reuse figure is measured, and comes from our earlier page-load work rather than from this run.
Network behaviour varies by route, time of day and congestion. The method here is reproducible on your own connection; the numbers it produces will be yours rather than these.

View author profile → · Editorial policy