The Punnett square is the first piece of genetics most people are taught, and for good reason: it is one of the great teaching diagrams. Two parents, four boxes, and out drops the famous three-to-one.
Then the lesson usually adds a sentence that is flatly wrong — that in a family of four, three children will show the dominant trait and one will not.
What the square actually says
Cross two carriers and the square gives a genotype ratio of 1:2:1 and a phenotype ratio of 3:1, both taken from the engine our own calculator runs on.
What they describe is a probability. Each child independently has a three-in-four chance of showing the dominant trait. The square is a statement about chance, not a rota.
So we computed how often the promised outcome actually turns up.
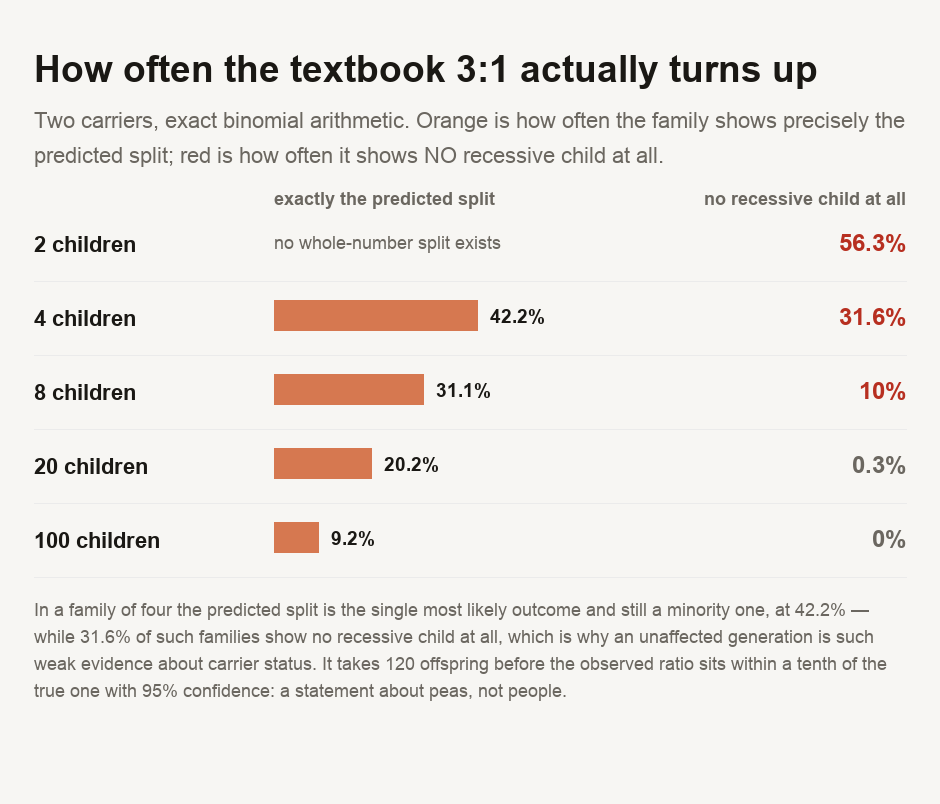
In a family of 4, the exact three-to-one split appears 42.2 per cent of the time.
It is the single most likely outcome, but still a minority one. Most four-child families of two carriers do not show three-to-one.
The number that surprises people
31.6 per cent of those families have no recessive child at all.
Nearly a third. Two carriers, four children, and the trait the square predicts in one of them appears in none.
With two children the numbers are starker, or better depending on what you were hoping for: 56.3 per cent see no recessive child. More than half.
This is why family history is such weak evidence about carrier status. A trait absent across a whole generation is entirely consistent with both parents carrying it, and the square is what tells you that — if you read it as probability rather than as a schedule.
How many children before the ratio shows up
Push the family size up and the observed share does converge on three-quarters, but far more slowly than the neatness of the diagram suggests.
This is a looser test than the figure above, which counts only the exact split. Loosen the test to allow the observed share anywhere within a tenth of three-quarters and the target is met 31.1 per cent of the time with 8 children, 56.1 per cent with 20, and 91.8 per cent with 100.
To be 95 per cent confident the observed ratio is within a tenth of the true one, you need 120 offspring.
Which is a perfectly reasonable number for peas, and Mendel had tens of thousands of them. It is not a reasonable number for a family, and that gap between the pea patch and the household is the thing the diagram quietly hides.
The dihybrid case, briefly
Cross two traits at once and the square gives 9:3:3:1 across sixteen boxes. The same problem is magnified: the rarest category now has a one-in-sixteen chance per offspring, so a family would have to be implausibly large before the observed counts meant anything.
A sixteen-box square is not sixteen outcomes waiting to happen. It is a weighting.
A Punnett square gives the odds for each child, not a quota for the family. The textbook three-to-one turns up 42.2 per cent of the time in a four-child family, so more often than not you will see something else, and 31.6 per cent of the time you will see no recessive child at all — which is why an unaffected generation is such weak evidence that nobody is carrying anything. For the observed numbers to reliably match the predicted ones you need about 120 offspring, a sample size fit for peas rather than people. And remember this is a simplified model of a single gene; real human traits are rarely so tidy. Do not use a square to reason about your own family — that is a conversation for a genetic counsellor with your actual history in front of them.
Working the squares yourself
Our Punnett square calculator builds the grid for one or two genes and gives the ratios this guide starts from. The Hardy-Weinberg calculator is the population-level version of the same idea, where large numbers make ratios behave, and the allele frequency calculator works the other way round, from observed counts back to the frequencies underneath. The problem of small samples being misleading is not unique to genetics: confidence intervals and standard deviation against standard error address the same trap elsewhere.
- The genotype and phenotype ratios come from
science-kernel.js, the module our own Punnett square calculator runs on, so this guide cannot drift from the tool it describes. - The probabilities are exact binomial arithmetic in integer fractions, with no floating point until the final percentage. A ratio is not a count, and the arithmetic demonstrating that should not itself be approximate.
- ⚠️ NOTHING HERE CONCERNS A REAL FAMILY, TRAIT OR PERSON. This is the textbook single-gene model: one gene, two alleles, complete dominance, independent births.
- ⚠️ REAL HUMAN TRAITS ALMOST NEVER WORK THIS WAY. Most involve many genes, incomplete or co-dominance, variable expression and environment. A square is a teaching model, and this guide is about the model's own arithmetic rather than about inheritance in practice.
- ⚠️ THIS IS NOT GENETIC ADVICE and must not be used to reason about anyone's own family or reproductive decisions. Carrier status, risk and testing are questions for a qualified genetic counsellor with a real history in front of them.
- ⚠️ INDEPENDENT BIRTHS ARE ASSUMED, which is what makes the binomial the right tool. That assumption holds for the model and would need checking against any real dataset before these figures were applied to one.
This article explains the arithmetic inside a teaching diagram. It is not genetic, medical or reproductive advice. It describes a simplified model, not how any particular trait is actually inherited.

View author profile → · Editorial policy