

Every FIRE forum has the same number pinned to its ceiling: withdraw 4% of your portfolio in your first retirement year, raise the dollar amount with inflation each year after, and the money lasts. The rule travels light, rarely accompanied by the fine print from the two studies that produced it. The first was William Bengen's 1994 article in the Journal of Financial Planning; the second was a 1998 stress-test from three finance professors at Trinity University.
This guide walks both papers as written, shows where the popular rule departs from them, follows Bengen's own revisions — he no longer says 4% — and asks what the rule means in Singapore and Malaysia, where CPF LIFE and EPF change the shape of the problem. It is the finance entry in our pedigree series, which traces famous numbers back to their primary documents.
Before anything else: this guide is informational. It never tells you what your withdrawal rate should be — the studies themselves refuse to, and personalised recommendations on withdrawing or investing retirement savings are regulated financial advice in both Singapore and Malaysia. For your own numbers, talk to a licensed adviser.
What Bengen actually did in 1994
Bengen asked a practical question: what is the maximum first-year withdrawal rate, as a percentage of initial portfolio value, that ensures "clients will not outlive their money"? He took actual US returns and inflation from the Ibbotson Associates Stocks, Bonds, Bills and Inflation: 1992 Yearbook and simulated a retiree starting in every year from 1926 to 1976, on a baseline of 50% stocks and 50% intermediate-term Treasuries, rebalanced continually. The mechanics matter, because the percentage applies only once. Year one, you withdraw 4% of the portfolio; every year after, last year's dollar amount plus inflation, regardless of performance.
His finding, in his own words: "Assuming a minimum requirement of 30 years of portfolio longevity, a first-year withdrawal of 4 percent, followed by inflation-adjusted withdrawals in subsequent years, should be safe. In no past case has it caused a portfolio to be exhausted before 33 years, and in most cases it will lead to portfolio lives of 50 years or longer."
So 4% is a worst-case first-year rate over a 30-year floor — not an average, not a forever rate. The margins were thin: at 4.25%, a portfolio could die in as little as 28 years "were past conditions to repeat themselves"; at 3% — and as high as roughly 3.5% — the rate was "absolutely safe (to the extent history is a guide)", never below 50 years. The worst start years were 1966 and 1969. These retirees walked straight into Bengen's "Big Bang": the 1973–74 bear market, where stocks fell 37.2% while cumulative inflation rose 22.1%.
On allocation he was blunt: hold stocks "as close to 75 percent as possible, and in no cases less than 50 percent" — outside the 50–75% band was "counterproductive". And the paper carries assumptions the popular rule forgot: all assets tax-deferred, so taxes never enter the maths, and no advisory or fund fees modelled. A 5% initial rate he called "risky"; "six percent or more is 'gambling'".
Trinity 1998: the grid everyone quotes
In February 1998, Philip Cooley, Carl Hubbard and Daniel Walz of Trinity University published "Retirement Savings: Choosing a Withdrawal Rate That Is Sustainable" in the AAII Journal. Where Bengen reported worst cases, Trinity built a grid of possibilities. They tested rates from 3% to 12% over 15-to-30-year periods, across five allocations from 100% stocks to 100% bonds, using S&P 500 and long-term high-grade corporate bond returns from 1926–1995. Note the different instruments. Trinity used long-term corporate bonds where Bengen used intermediate Treasuries, making the studies cousins, not identical tests.
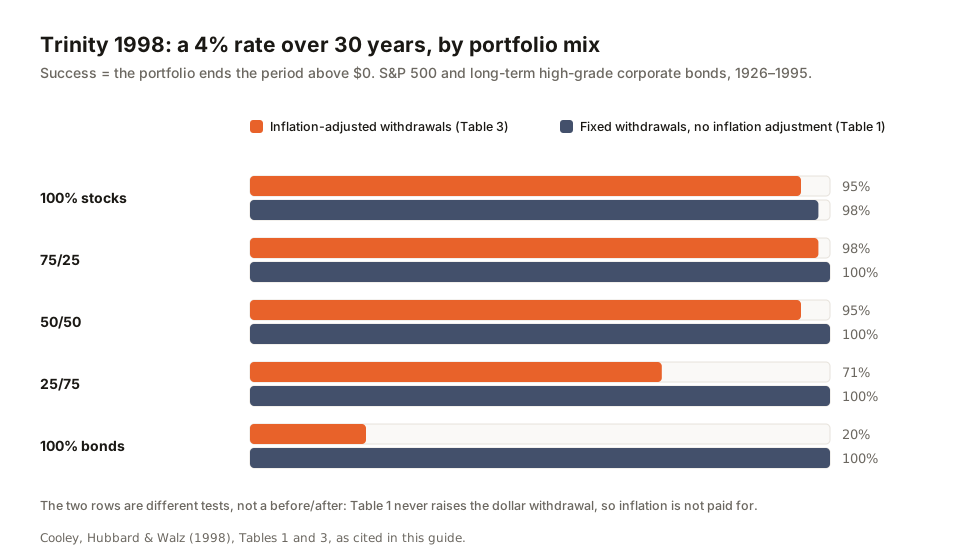
Their success metric is narrower than most people assume. A payout period is a success if the ending value exceeds $0. A portfolio that crosses the 30-year line with a dollar left counts as a success; bequests sit in a separate terminal-values table, outside the success rates. The row the internet remembers:
| 4% rate, 30-year period | 100% stocks | 75/25 | 50/50 | 25/75 | 100% bonds |
|---|---|---|---|---|---|
| Inflation-adjusted withdrawals (Table 3) | 95% | 98% | 95% | 71% | 20% |
| Fixed withdrawals, no inflation adjustment (Table 1) | 98% | 100% | 100% | 100% | 100% |
- Portfolio needed
- 1,000,000
- As a multiple of spending
- 25.0×
The whole rule is one division. Change the rate and watch the multiple move: 4% is 25x, 3.5% is 28.6x, 4.5% is 22.2x.
Trinity's authors flagged their own limit in a sentence quoted far less often than the grid: "The study did not adjust for taxes or transaction costs." Their reading cut both ways — 3% and 4% from stock-dominated portfolios represent "exceedingly conservative behavior", but "early retirees who anticipate long payout periods should plan on lower withdrawal rates". They also rejected the word later attached to their work: choosing a rate "is not a matter of contract but rather a matter of planning", with mid-course corrections likely.
What neither study said
Most misuse of the 4% rule comes from quoting the headline while dropping the stated assumptions.
- It is not a forever rate. Both studies test a fixed window — Bengen's 30-year floor, Trinity's 15-to-30-year periods. For 50-year horizons Bengen's 1994 band was 3–3.5%; in 2025 he put a 50-year retirement closer to 4.2%.
- It is not net of fees or taxes. Bengen assumed tax-deferred accounts and modelled no fees; Trinity adjusted for neither taxes nor transaction costs, by its own statement.
- It is not a guarantee. Bengen: "to the extent history is a guide". Trinity: "if history is any guide for the future". Both are backtests of one country's unusually good century.
- It is not allocation-agnostic. Bengen's result requires 50–75% stocks; Trinity's 4%/30-year cell falls to 71% success at 25/75 and 20% at 100% bonds.
- It is not universal. Both datasets are US returns — the export record is next.
Fees, taxes and the rest of the world
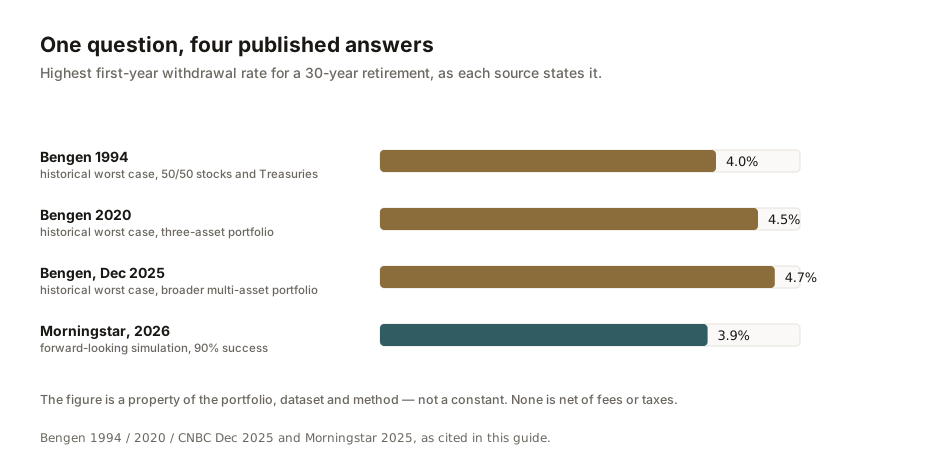
Morningstar's The State of Retirement Income: 2025 (December 2025) re-runs the question with forward-looking Monte Carlo simulation rather than historical replay, at a 90% success target over 30 years. For 2026 retirees, it recommends a 3.9% starting rate for consistent inflation-adjusted spending. The highest supported rates come from portfolios with only 30–50% in equities, and the base case has bounced between 3.3% and 4.0% across five annual reports. It also quantifies the fee caveat the originals could only state: 1% in annual expenses on a 60/40 portfolio drops the base case from 3.9% to 3.4%, before taxes take a further cut — the research itself, Morningstar notes, incorporates neither expenses nor taxes.
The geographic caveat has numbers too. Wade Pfau tested the classic approach against 1900–2008 data for 17 developed markets: the historical worst-case rate exceeded 4% in only four — Canada, Sweden, Denmark and the United States — and over 30-year retirements the rule failed in 62.5% of historical cases in Italy and 42.5% in France. US-only data from 1926 onward is, internationally, an optimistic sample.
Bengen kept revising his own number
The rule's creator never treated 4% as scripture. In a 2020 Financial Advisor article he put the highest safe 30-year rate at 4.5%, based on a worst-case retiree leaving work on 1 October 1968, on a three-asset portfolio (30% US large-cap, 20% small-cap, 50% intermediate government bonds), still tax-advantaged with CPI adjustments; favourable-era retirees could historically have taken up to 13%. That article also defines "SAFEMAX" — a term he later coined for the highest first-year rate that historically sustained a portfolio for a given period; the word appears nowhere in the 1994 paper. His closing disclaimer is worth keeping whole: "The term 'safe' is meaningful only in its historical context, and does not imply a guarantee of future applicability."
By December 2025, in a CNBC Make It interview, the number had moved again: 4.7% for a 30-year retirement, built on a broader multi-asset portfolio including mid-, micro-cap and international stocks. Of people still using 4%: "I think they're cheating themselves a little bit" — though he cautioned in the same breath, "You don't know what the market or inflation could do. You don't know how long you'll live."
Bengen's own figure has moved from 4% to 4.5% to 4.7% as his asset menu widened, a reminder that the number is a property of the portfolio and dataset, not a constant of nature. And his 4.7% is no consensus; Morningstar's same-season figure is 3.9%. The gap is method — historical worst case versus forward simulation at 90% confidence — plus different portfolios, with fees and taxes outside both.
Sequence of returns: the start year decides
The mechanism was already in the 1994 paper. Bengen observed that the 1973–74 bear market's damage "can be seen to reach back" to portfolios whose withdrawals began 20 or more years earlier, and drew the lesson: do not raise your rate after a few good early years. His starkest case is the 1929 retiree — a "black hole" client in his taxonomy — who started at 4% and by the end of 1932 was withdrawing about 7.6% of what remained. The rule and discipline were the same; the start date did the damage. As he put it in 2025, an early bear market "sucks a lot out of the portfolio at the same time that you're drawing from it".
The dispersion is enormous. Morningstar's replay for a 50/50 portfolio across rolling 30-year windows finds starting safe rates from 3.9% (retirees beginning late 1968) to 10.5% (mid-1982). Note the convergence: Morningstar's worst window and Bengen's 2020 worst case are the same person — the unlucky saver of late 1968 — found independently by two methods. The safe rate is set by your worst plausible opening decade, not by average returns.
Singapore and Malaysia: an annuity floor and a 20-year drawdown
The 4% rule assumes a retiree who self-manages a portfolio and personally bears both market and longevity risk. Neither system closest to home matches that picture.
In Singapore, CPF LIFE is — in CPF Board's own words — "a national longevity insurance annuity scheme that provides you with monthly payouts no matter how long you live." Longevity risk is pooled, not borne alone. Three plans: Standard (a steady payout), Escalating (starts lower, grows 2% a year for life), Basic (starts low, falls when CPF balances drop below $60,000); payouts start at 65, deferrable to 70 for up to 7% more per deferred year, capped at 35%. So a retiree with a CPF LIFE floor runs the 4%-style question only on savings outside the annuitised base — and a lifelong floor under essential spending is exactly what a 30-year backtest cannot model.
Malaysia's EPF frames adequacy a third way. Its Belanjawanku benchmark (with Universiti Malaya's Social Wellbeing Research Centre) puts a single elderly person's needs at about RM2,690 a month, and its Retirement Income Adequacy framework, effective January 2026, sets three savings tiers at age 60: Basic RM390,000, Adequate RM650,000, Enhanced RM1.3 million. The middle tier's arithmetic is neither a 4%-style perpetual rule nor an annuity — it is RM2,690 × 240 months, rounded up to the next RM10,000, a straight 20-year drawdown aligned with average Malaysian life expectancy; EPF's illustration has RM650,000 supporting RM2,708 a month in year one, rising to RM7,389 by year 20. The region already runs three models side by side: pooled annuity, fixed-window drawdown, and the self-managed withdrawal the Bengen/Trinity evidence covers. For the two national systems head to head, see our guide to EPF vs CPF in 2026.
Our calculators, and what we fixed today
We audited our own tools against the primary sources for this guide, and our safe withdrawal rate calculator did not fully pass. As of today (22 July 2026) it is corrected: it no longer describes any portfolio as supporting spending "indefinitely" (both studies are fixed-window tests); its rate labels now track the papers — 4% tied to the classic 30-year evidence, 3% to Bengen's absolutely-safe band, 4.5% as his revised 30-year figure under his own assumptions; a metadata claim about Guyton-Klinger guardrails the tool never implemented is removed; and a horizon input that fed no calculation is gone. Guide and tool now teach the same caveats.
The FIRE number calculator is the same arithmetic from the other end: a 25× expenses multiple is simply 1 ÷ 4%, so every caveat above transfers whole — at 3.5% the multiple becomes roughly 28.6×. The Coast FIRE calculator compounds current savings toward that target and inherits the same assumptions. Our retirement calculator deliberately uses a flat 20-year drawdown — the convention EPF's framework also adopted — with CPF LIFE's current plan names (Basic/Standard/Escalating) in its Singapore notes. All four are simplified aids for exploring the arithmetic, not advice engines.
FAQ
Did Bengen call it "the 4% rule" or "SAFEMAX" in 1994?
Neither term appears in the 1994 paper. "SAFEMAX" is a label Bengen later coined for the highest first-year rate that historically sustained a portfolio for a given period — 30 years, tax-advantaged, in his usage. "The 4% rule" is the internet's name, not his.
Is the 4% rule still valid in 2026?
The answer depends on the method. Bengen's current 30-year figure is 4.7% on a broad multi-asset portfolio (December 2025 CNBC interview); Morningstar's forward-looking estimate is 3.9% at 90% confidence. Both exclude fees and taxes, and both sides call their numbers guides, not guarantees.
Does the 4% rule work outside the United States?
Historically, mostly not. Across 17 developed markets from 1900 to 2008, Pfau found the worst-case rate exceeded 4% in only four; over 30-year windows the rule failed in 62.5% of Italian and 42.5% of French historical cases. The original studies never claimed otherwise — both test US data.
Does the 4% rule apply to CPF or EPF savings?
Not directly. CPF LIFE is a lifelong annuity — payouts continue no matter how long you live, so there is no portfolio to deplete. EPF's adequacy framework is built on a 20-year straight drawdown, a different model again. The 4%-style question mainly concerns savings you manage yourself outside those schemes — and decisions there belong with a licensed adviser.
- Bengen, "Determining Withdrawal Rates Using Historical Data" — Journal of Financial Planning, Oct 1994 (FPA reprint PDF) (accessed 22 Jul 2026)
- Cooley, Hubbard & Walz, "Retirement Savings: Choosing a Withdrawal Rate That Is Sustainable" — AAII Journal, Feb 1998 (via Internet Archive) (accessed 22 Jul 2026)
- Bengen, "Choosing The Highest Safe Withdrawal Rate At Retirement" — Financial Advisor, 1 Oct 2020 (accessed 22 Jul 2026)
- Ermey, "Why early retirees may be 'cheating themselves,' says 4% rule creator" — CNBC Make It, 18 Dec 2025 (accessed 22 Jul 2026)
- Arnott, Benz, Kephart & Guo, "The State of Retirement Income: 2025" — Morningstar, 3 Dec 2025 (report PDF) (accessed 22 Jul 2026)
- Pfau, "Retirement Withdrawal Rates and Portfolio Success Rates: What Can the Historical Record Teach Us?" — MPRA #31122, May 2011 (accessed 22 Jul 2026)
- CPF LIFE — monthly payouts — CPF Board, cpf.gov.sg (accessed 22 Jul 2026)
- EPF releases Belanjawanku 2024/2025 and Retirement Income Adequacy framework — KWSP, 12 Dec 2024 (accessed 22 Jul 2026)