Two people walk into the same gym, both 60 years old. The poster on the wall tells them their maximum heart rate is 220 minus your age — so 160 beats per minute. But the most extensively validated peer-reviewed equation — built from 351 studies and lab-checked on 514 adults — puts a 60-year-old's estimated max at 166 bpm. Same age, same afternoon, a 6-bpm disagreement before anyone has taken a single step on the treadmill.
Six beats might sound trivial. But it decides which "zone" your watch congratulates you for, and the gap only widens with age. Like our BMI, BMR and TDEE guide, this one traces every number back to its source. We sort the research-backed figures from the conventions repeated until they sound official, and show how our own calculators handle the mess.
What "maximum heart rate" actually is
Your maximum heart rate (HRmax) is the highest number of beats per minute your heart can reach during all-out effort. It is not a fitness score — fitter people do not have higher maximums. It mostly falls with age, and it varies from person to person for reasons no formula captures. The only way to measure your true max precisely is a supervised maximal-effort test, which is exactly why it is normally reserved for clinical settings and not something to chase alone on a Sunday run.
Because most people never do that test, every fitness app, gym poster and smartwatch estimates HRmax from your age. That estimate anchors everything downstream: your "fat-burn" zone, your "cardio" zone, the ring that fills on your wrist. So how good is the estimate? Good enough for a population, but rough for an individual.
The "220 − age" pedigree problem
The formula printed on nearly every gym wall, 220 minus your age, has a surprisingly thin paper trail. It is usually traced to a 1971 paper by Fox, Naughton and Haskell. That paper is a review article, and its PubMed record states plainly: "No abstract available." The equation was not the output of one designed maximal-exercise experiment; it emerged from a fitted line across existing data.
The often-repeated origin story — that someone eyeballed a line through roughly ten datasets — is consistent with the evidence but cannot be cleanly verified, because the primary paper is paywalled and abstract-less. What is verifiable is why later researchers redid the work: the team behind the modern replacement wrote that the traditional equation "was not derived from original research." The most famous number in fitness was never really tested the way people assume.
The equations with a real cohort behind them
Two peer-reviewed studies did the work properly and are now the foundation of modern heart-rate guidance.
The direction of the error flips with age, as the numbers show:
| Age | 220 − age (classic) | Tanaka (208 − 0.7×age) | Gulati, women (206 − 0.88×age) |
|---|---|---|---|
| 30 | 190 | 187 | 180 |
| 40 | 180 | 180 | 171 |
| 60 | 160 | 166 | 153 |
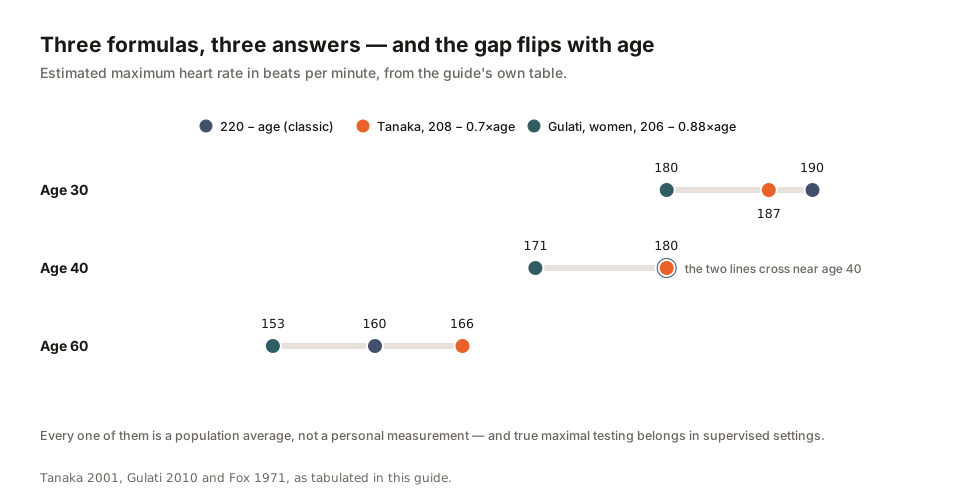
At 30, the classic formula reads a touch high. At 40, the lines converge. At 60, the classic formula is now 6 bpm low versus Tanaka — the older-adult underestimation the researchers warned about — and a 60-year-old woman using Gulati lands at 153, a full 7 bpm below the wall poster. There is no single "true" number. There is a spread, and the formula you pick shifts your zones by several beats per minute.
One caveat on Gulati: it comes from a symptom-limited treadmill cohort, so it estimates a women-specific peak HR for age, not a guaranteed physiological maximum. Treat it as the best women-specific estimate available, not a lab certificate.
Where the authorities differ: AHA bands vs CDC's retreat from them
The American Heart Association—the largest US heart body—still publishes 220 − age for population guidance, even while its own field's research shows the formula is systematically off. That is not a scandal; it is a design choice. A population screening guideline values simplicity and memorability over per-person precision. The two major US authorities do not even use the same intensity bands:
| Intensity | AHA (% of HRmax) | CDC (current guidance) |
|---|---|---|
| Moderate | 50–70% | Effort 5–6 on a 0–10 scale; you can talk but not sing |
| Vigorous | 70–85% | Effort begins at 7–8 of 10; no more than a few words without a breath |
| HRmax method | 220 − age | Not published — effort scale only |
- HRmax (Tanaka)
- 180 bpm
- Heart-rate reserve
- 110 bpm
- Target zone
- 136–147 bpm
Karvonen works from heart-rate reserve, so it needs your resting rate and returns higher targets than a flat percentage of HRmax.
Both are authoritative and current, but they no longer speak the same language. The AHA still anchors its bands to 220−age percentages; the CDC's intensity page, in its current revision (we checked the live page on 21 July 2026), defines moderate and vigorous without heart-rate percentages at all, using a 0–10 relative-effort scale and the talk test. One major authority has quietly stepped back from heart-rate arithmetic altogether. A rough formula and broad bands are fine for population guidance, which needs to get millions of people moving safely, not to fine-tune one athlete's threshold. Individual training is where the rough edges start to matter.
The Karvonen method: bringing in your resting heart rate
A straight percentage-of-max calculation ignores your resting heart rate (RHR). The Karvonen method, from a 1957 Finnish training study, uses your heart-rate reserve (HRR), the room between rest and max:
HRR = HRmax − HRrest, then Target HR = HRrest + (%intensity × HRR).
The AHA puts a normal adult resting heart rate at "between 60 and 100 beats per minute" when calm; well-trained athletes often sit lower because their heart muscle does not have to work as hard (the AHA does not attach a specific low figure, so we won't either). For a 40-year-old with a resting HR of 70, the math works like this:
Karvonen gives higher target numbers than plain %HRmax because it anchors to your actual resting pulse. Neither is "wrong" — but they are not interchangeable, and a watch that quietly switches between them will hand you different zones for the same effort.
The five-zone ladder: convention, not a standard
Every training app slices effort into five neat zones — Z1 through Z5, in tidy 10% steps. It looks official. It is not, in the sense most people assume.
The tidy Z1–Z5 ladder (50–60 / 60–70 / 70–80 / 80–90 / 90–100%) is a training convention, not a figure any major heart authority publishes. The AHA defines only two bands (moderate 50–70%, vigorous 70–85%). The CDC's current page defines intensity by relative effort and the talk test rather than %HRmax bands. The WHO defines minutes per week, not heart-rate zones. The decile ladder comes from coaching and wearable literature — useful for structuring a workout, but do not mistake it for a public-health standard the way you might a blood-pressure cutoff.
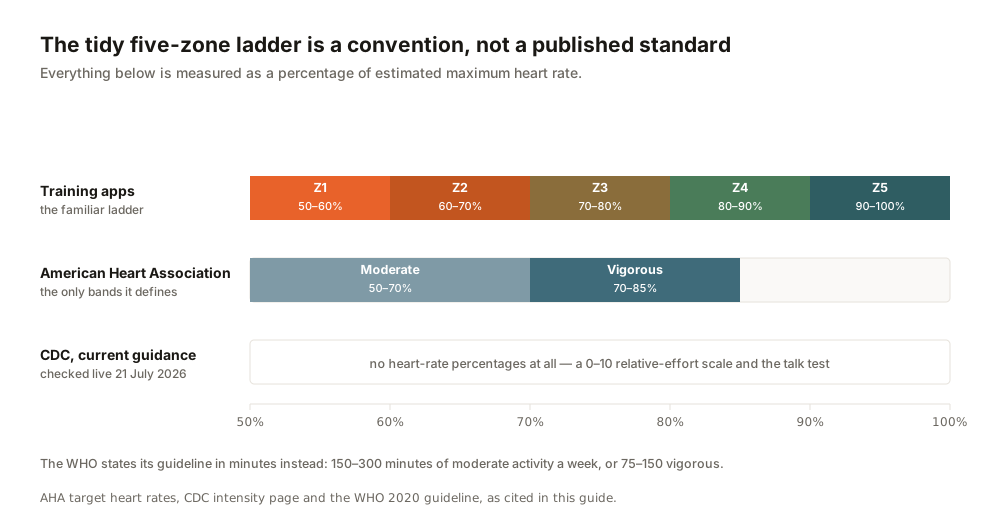
Like the activity-multiplier ladder in our BMI guide, it is a convenient scaffold that has quietly acquired the authority of a measurement. Use it to organize training if you like — just know what it is.
How much, per week: the WHO number
If zones feel like too much machinery, the World Health Organization's 2020 guideline is refreshingly zone-free. Adults should do 150–300 minutes of moderate-intensity activity, or 75–150 minutes of vigorous-intensity, or an equivalent combination, each week. No heart-rate monitor required — which brings us to the zero-math alternative.
The talk test, used by the CDC and US physical-activity guidelines, needs no device: during moderate activity you can talk but not sing; during vigorous activity you cannot say more than a few words without pausing for breath. For most people, that is all the "zone" tracking they need.
Who the formulas mislead
Age-prediction formulas are least accurate for specific groups, and ignoring the variance is how people get hurt or discouraged.
The safe default for everyone is the age estimate, not a self-administered all-out max test — clinical practice keeps true maximal-effort testing to supervised settings for good reason. If you take medication that affects heart rate or have a heart condition, the estimate is a starting point for a conversation with your doctor, not a target to chase.
How our calculators handle this — honestly
We ship three heart-rate tools, and they make deliberately different trade-offs. All three, we should say plainly, build on the conventional zone ladder disclosed above (the max-HR tool shows four of its five bands, skipping recovery) — none of them invented a sourced standard, because none exists.
The practical takeaway is to use the zones calculator or the general calculator if you know your resting heart rate, so the math reflects you. To compare how the formulas disagree, the max-HR calculator lays them out at a glance — just remember its zone numbers assume a resting pulse of 65.
Frequently asked questions
So which formula should I actually use?
For a general estimate, Tanaka (208 − 0.7×age) has the strongest research backing. Women may prefer Gulati (206 − 0.88×age), developed from a women-only cohort. The differences are small; picking one formula and using it consistently is what matters.
Why does my watch show different zones than this guide?
Wearables differ in which HRmax formula they use, whether they apply Karvonen or straight %HRmax, and where they draw zone boundaries. Some also personalize from your workout history. None of these approaches is uniquely "correct" — they are different conventions, which is exactly why zone numbers vary between devices.
Is it dangerous to train near my maximum heart rate?
For healthy people, brief high-intensity efforts are a normal part of vigorous exercise. The caution is against two things: testing your true maximum unsupervised, and using any age formula without medical input if you have a heart condition or take heart-rate-affecting medication. If in doubt, use the talk test and speak to your doctor.
Do I even need heart-rate zones to be healthy?
No. The WHO guideline is stated in minutes — 150–300 moderate or 75–150 vigorous per week — not zones. The talk test is enough to hit it. Zones are a tool for structuring training, not a requirement for health.
This guide is general information, not medical advice. Heart-rate formulas are population estimates, not personal measurements, and none of the numbers here should be treated as a training prescription. If you take medication that affects your heart rate, have a heart condition, or are unsure how to exercise safely, consult a qualified healthcare professional.
- Tanaka, Monahan & Seals — "Age-predicted maximal heart rate revisited," J Am Coll Cardiol 2001 (PMID 11153730) (accessed 21 Jul 2026)
- Gulati et al. — women's maximal heart rate, Circulation 2010 (PMID 20585008) (accessed 21 Jul 2026)
- Fox, Naughton & Haskell — Ann Clin Res 1971, review article, no abstract (PMID 4945367) (accessed 21 Jul 2026)
- Karvonen, Kentala & Mustala — training and heart rate, 1957 (PMID 13470504) (accessed 21 Jul 2026)
- American Heart Association — Target Heart Rates chart (50–70% / 70–85%, medication caveat) (accessed 21 Jul 2026)
- American Heart Association — All About Heart Rate (resting 60–100 bpm) (accessed 21 Jul 2026)
- CDC — How to Measure Physical Activity Intensity (0–10 relative-effort scale, talk test; page revised Dec 2025) (accessed 21 Jul 2026)
- Bull et al. — WHO 2020 Guidelines on Physical Activity, Br J Sports Med (DOI 10.1136/bjsports-2020-102955) (accessed 21 Jul 2026)
- Nes BM et al.: Age-predicted maximal heart rate in healthy subjects: The HUNT Fitness Study — Scand J Med Sci Sports, 2013;23(6):697–704 (PubMed) (accessed 21 Jul 2026)

View author profile → · Editorial policy