
Paste a column of salaries into our own mean, median and mode calculator the way a spreadsheet hands them to you — $45,000 on one line, $52,000 on the next — and until this morning the tool answered with a mean of zero. No error, no warning. A clean, formatted zero, with n = 2 printed beside it as though the count proved something.
That bug is fixed, with a post-mortem at the end of this guide. The bug is a fitting way in. An average is not a measurement you take; it is a number you choose. Three different answers are all correctly called "the average" of the same data, and which one gets printed changes what a reader concludes. Statistical agencies know this. Singapore's Department of Statistics, Malaysia's DOSM and the US Census Bureau all publish the mean and the median of household income side by side, and all three put the median, not the mean, in the text a reader actually reads — the US report's body prints only the median, and DOSM's release leads with it.

Three numbers, one word
Mean, median and mode are not three names for one idea. They answer three unrelated questions, and on skewed data they land far apart.
The mean is the total shared equally; add everything up and divide by how many there are. The median is positional: sort the values and take the middle one, or the average of the two middle ones if the count is even. The mode is the value that occurs most often, and on data where nothing repeats there simply isn't one.
Take ten monthly salaries, hand-built to make the point: 2,800 · 3,000 · 3,200 · 3,400 · 3,600 · 3,800 · 4,000 · 4,500 · 5,200 · 48,000. Nine ordinary pay packets and a founder. The mean is 8,150. The median is 3,700. There is no mode, because every value appears once.
| On the same ten salaries | Mean | Median | Mode |
|---|---|---|---|
| The question it answers | What would each person get if the total were shared out equally? | What does the person in the middle get? | Which figure comes up most often? |
| Value | 8,150 | 3,700 | none — every value is unique |
| Drop the single top earner | falls 54.3%, to 3,722.22 | falls 2.7%, to 3,600 | still none |
| Moved by one changed value? | Yes, and without limit | Only if it changes or crosses a middle value | Only if it creates or breaks a tie |
Nobody in that payroll earns 8,150. The mean is not a person; it is the answer to a division problem. That is not a flaw — it is what a mean is for. Total wage cost divided by headcount is exactly the number a finance department needs, and no other average will do. The trouble starts when the answer to a finance question gets presented as the answer to a human one: what does a typical worker here take home?

Singapore and Malaysia publish both, and lead with one
The agencies' own paperwork shows the choice being made. Singapore's Department of Statistics publishes Key Household Income Trends, 2025. Annex Table 8 gives average and median monthly household market income for resident households. The average is S$16,159. The median is S$12,446. That is a gap of S$3,713 a month between two figures describing the same households in the same table — and only the median appears in the report's body text.
Malaysia's Department of Statistics reports the same shape from an entirely separate survey. The Household Income Survey Report Malaysia 2024, Table 2.7, puts monthly household gross income at a median of RM7,017 and a mean of RM9,155. DOSM's own machine-readable file hh_income.csv carries the identical pair, 2024-01-01,9155,7017. Divide mean by median in either country and you get the same answer to two decimal places: 1.30×.
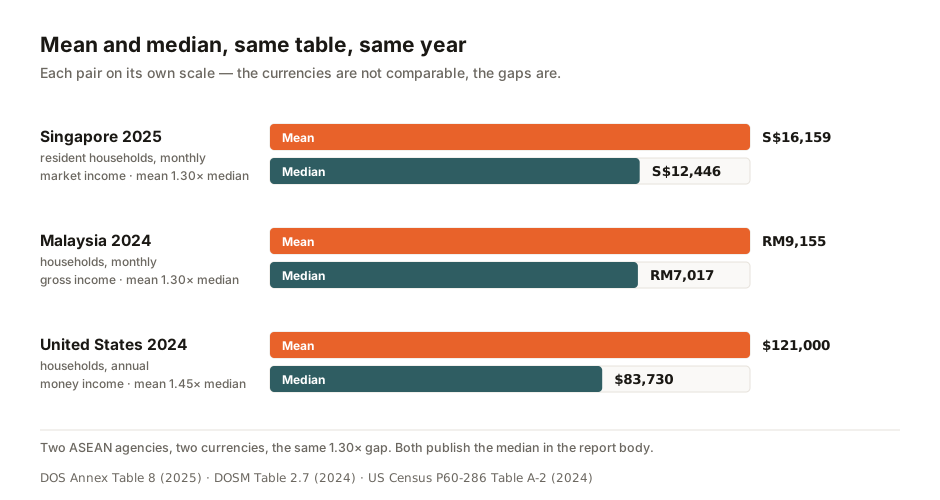
One caution before anyone lines these up in a spreadsheet. The Singapore figure is monthly market income — a measure DOS widened for the 2025 edition to include non-employment income and to cover households with nobody employed. The Malaysian figure is monthly gross income from a different survey. The US figure is annual and pre-tax. The levels are not comparable, but the gap is.
DOSM states the reason in its own vocabulary. From the Summary of Findings: "This difference indicates a positively skewed (skewed to the right) income distribution, where the mean value is influenced by the majority of households with higher incomes." Its decile groups show the mechanism directly, on printed p.51 (PDF p.69). Exhibit 7 puts D1–D4 households at a mean of RM3,814 against a median of RM3,815 — almost the same number. The Summary of Findings text beside it has D5–D8 parting slightly, RM8,744 against RM8,599, and D9–D10 separating sharply, RM20,662 against RM16,517. Averaging a distribution with a long right tail pulls the mean up the tail; the median stays where the households are.
The same report contains a trap. In Table 2.7, the by-state table, the 2024 median monthly household gross income in W.P. Kuala Lumpur was RM10,802 and in Kelantan RM4,083 — a ratio of 2.65×. Put Kuala Lumpur's mean of RM13,985 against Kelantan's median, and the same two states in the same table appear 3.43× apart. Nothing changed except which column each figure came from, and the gap widened by 29%.
The rule, written down
The United States publishes the instruction manual. Buried in the Census Bureau's 2024 ACS Subject Definitions, on page 97 under "Mean Income", is the reasoning in the agency's own words:
"Care should be exercised in using and interpreting mean income values for small subgroups of the population. Because the mean is influenced strongly by extreme values in the distribution, it is especially susceptible to the effects of sampling variability, misreporting, and processing errors. The median, which is not affected by extreme values, is, therefore, a better measure than the mean when the population base is small."
The companion entry on the previous page defines the median with no hedging at all: it "divides the income distribution into two equal parts: one-half of the cases falling below the median income and one-half above the median."
Then the Bureau's own data shows what that costs. Income in the United States: 2024 — report P60-286, Table A-2, the ALL RACES panel — gives median household money income of $83,730 and mean household money income of $121,000 — the same households, the same survey, the same year. The mean sits $37,270 higher — 1.45× the median, 44.5% above it. The report's body text mentions only the median; the mean is in the annex, unremarked.
Britain's Office for National Statistics says the same thing in plainer language: a limitation of the mean "is that it can be influenced by just a few individuals with very high incomes and therefore does not necessarily reflect the standard of living of the 'typical' person". Singapore's Ministry of Manpower puts the caution on its own headline earnings series: "as AME pertains to mean earnings, it can be skewed upwards by a small number of very high income earners." That sentence is written about Average Monthly Earnings, not household income — keep the subject attached when you quote it.
What one changed value actually does
Singapore's Department of Statistics runs the demonstration itself. In a February 2026 infographic answering why the reported median household income differs from personal experience, DOS lays out five households, identifies the middle one, and then makes a point of breaking the ends:
"These median values remain even if the household with the lowest income (i.e., Household A) had their household income halved to $1,000 or the household with the highest income (i.e., Household D) had their household income doubled to $30,000."
DOS draws the conclusion in the box below it: "The median is a summary statistic that is not impacted by changes in the extreme ends of the distribution." The agency is equally frank about the limit of that virtue — the median "is not meant to reflect the lived experience of all households or individual members of the household", because some households gain while others lose and a single summary figure records neither.
Run the same experiment on the ten-salary payroll and you can watch the two averages behave completely differently. Take the nine ordinary salaries, add one more person, and vary only that person's pay:
BASE (9 values, no boss): [2800, 3000, 3200, 3400, 3600, 3800, 4000, 4500, 5200]
  mean   = 3722.22
  median = 3600

Now add ONE more person, and vary only that person's pay:
   added value |   n |         MEAN |  mean shift |   MEDIAN | median shift
------------------------------------------------------------------------------
         4,000 |  10 |     3,750.00 |      +27.78 |  3,700.0 |       +100.0
        10,000 |  10 |     4,350.00 |     +627.78 |  3,700.0 |       +100.0
              […] rows for 6,000 · 20,000 · 100,000 elided
        48,000 |  10 |     8,150.00 |   +4,427.78 |  3,700.0 |       +100.0
     1,000,000 |  10 |   103,350.00 |  +99,627.78 |  3,700.0 |       +100.0
    10,000,000 |  10 | 1,003,350.00 | +999,627.78 |  3,700.0 |       +100.0
The median moves once, by 100, when the tenth person joins and shifts where the middle falls. After that it does not move again, however large the added salary gets. The mean has no ceiling at all. Statisticians give this a name: the breakdown point, the share of the data that has to be corrupted before a summary can be dragged anywhere you like. For the mean it is a single value out of any number. For the median you need a majority.
This doesn't make the median the honest average and the mean the dishonest one. The mean carries information the median throws away — it is the only one of the three that knows the total, which is why it is the right tool for a wage bill, a tax take or a per-capita figure. It is also the one that a single extreme value can move without limit, so it needs the distribution's shape reported alongside it. Publishing both, as DOS, DOSM and the Census Bureau all do, is the honest answer.
The average that most people are below
People tend to read "above average" as "in the upper half". On a symmetric distribution, that's close enough. On income, it isn't.
In the ten-salary illustration, nine of the ten people earn less than the mean of 8,150. Exactly five earn less than the median of 3,700, because that is what a median is. Skew the data far enough and "below average" stops describing a minority at all. This is one reason a headline "average household income" so often fails to match anyone's experience. The number is not describing a middle; it was never built to.

The third average, and the datasets that have none
The mode gets left out of most of these arguments, because on continuous data like income it is nearly useless — no two households earn precisely the same amount, so nothing repeats. On categorical data it is the only average that works at all. The most frequently ordered dish, the most common blood type: no mean or median exists for those.
Software will happily invent a mode where there is none. Python's statistics.mode() returns the first value it meets when everything ties — hand it [1, 2, 3, 4] and it answers 1. Our calculator checks that the top frequency actually exceeds one before reporting anything, and prints none otherwise; on a genuine tie it reports every tied value rather than picking one, so [1, 1, 2, 2, 3] comes back as both 1 and 2. "No mode" is a valid answer.
Our own calculators, and what we fixed today
We audit the tools before we write about them, and the mean, median and mode calculator did not pass. The list parser split on commas before handing each piece to the number parser — and the number parser sitting one function above it reads 45,000 as forty-five thousand perfectly well when it is given the whole token. Splitting first guaranteed it never was.
parseList("45,000")  <-- one grouped number => [45,0]
parseList("45,000, 52,000, 61,000") => [45,0,52,0,61,0]
              […] one parseList case elided
parseList("$45,000\n$52,000") => [0,0]
              […] four more parseList cases elided
number.parse("45,000") direct (no split) => 45000
A single grouped salary became two data points. A currency column became zeros. The calculator reported a mean of zero with no complaint. Thirty-two tools load that shared kernel, and seven of them parse a list through it. The parser now tokenises first, under a documented rule: newlines, tabs, semicolons and pipes always separate records; a comma separates values unless the token is canonically grouped in threes. So 1,2,3 is still three numbers and 1,234 is one. Where the call is genuinely ambiguous — 100,200,300 is a valid grouped number and a valid list of three — the tool now tells you which reading it took instead of guessing in silence.
A second repair on the same page. With a single data point the tool used to print a sample variance and a sample standard deviation of 0. Sample variance divides by n − 1, which is zero here, so the quantity is undefined — and printing "0" asserts something false, that there is no spread. It now says undefined.
We checked and left three other things alone. The median correctly averages the two middle values on even-length data. The multimodal and no-mode handling was already right. And the 1.5×IQR outlier rule flagged 48,000 and nothing else, exactly as described.
The audit reached a second tool, revealing the same problem inside our own codebase. Our permutation and combination calculator computes exact integers with BigInt arithmetic — no rounding, however many digits. A sibling tool answering the same question computed it in floating point. Same input, two live pages, two different numbers:
--- the same question, the two live tools, one input: n=67 r=33 ---
  /permutation-combination-calculator/  (BigInt)  -> 14226520737620288370
  /combinations-permutations-calculator/ (double) -> 14,226,520,737,620,290,000
  difference                                      -> -1166
The wrong answer is the one that looks tidier. Both tools are exact now; the sibling was rewritten to use the same BigInt arithmetic. The permutation calculator had a display bug of its own: results above 30 digits were passed through a floating-point conversion on their way to the screen, and above about 308 digits that conversion returned Infinity, so 171 factorial — a 310-digit number the tool had computed perfectly — was rendered as "≈ Infinity". Scientific notation is now read off the integer's own decimal digits, and the exact value is kept on the element for copying.
FAQ
Is the median always the better average for income?
For finding what a typical household gets, yes. That is the position ONS and DOS state outright, the Census Bureau states for small population bases, and MOM states for average earnings. For anything that needs a total, however, the answer is no. Only the mean is consistent with aggregate income, which is why per-capita and national-accounts figures use it. The two answer different questions and neither substitutes for the other.
Why does the mean sit above the median for household income?
Because the distribution has a long right tail — DOSM's phrasing is "positively skewed (skewed to the right)". A small number of very high incomes lift the total, and therefore the mean, without moving the middle. All three agencies quoted above report the gap in that same direction.
Can I compare Singapore's household income figure with Malaysia's?
Not directly — the income concepts differ, and so do the surveys behind them. What travels between the three is the mean-to-median gap; the levels do not.
My spreadsheet column has currency symbols. Will the calculator read it?
It will now. Currency symbols and codes are stripped, and grouped thousands such as 45,000 or RM1,200 are read as single numbers. Where a comma could plausibly be either a separator or part of a number, the tool shows you which reading it used. Before today's fix, the same paste returned a mean of zero.
- U.S. Census Bureau, "American Community Survey and Puerto Rico Community Survey — 2024 Subject Definitions", pp. 96–97 (PDF) (accessed 26 Jul 2026)
- Kollar & Scherer, "Income in the United States: 2024" — Current Population Reports P60-286, Table A-2 (PDF) (accessed 26 Jul 2026)
- Department of Statistics Singapore, "Key Household Income Trends, 2025" — Annex Table 8 via SingStat Table Builder C030004 (accessed 26 Jul 2026)
- Department of Statistics Singapore, "Why Does the Reported Median Household Income Differ from My Personal Experience?" — infographic, 10 Feb 2026 (PDF) (accessed 26 Jul 2026)
- Ministry of Manpower, Manpower Research & Statistics Department — "Income: Introduction" (accessed 26 Jul 2026)
- Department of Statistics Malaysia, "Household Income Survey Report Malaysia 2024" — Table 2.7 and Summary of Findings (PDF) (accessed 26 Jul 2026)
- Department of Statistics Malaysia — open data,
hh_income.csv(mean and median household income, Malaysia) (accessed 26 Jul 2026) - Office for National Statistics, "Average household income, UK: Financial Year Ending 2024" — Section 5: Glossary (accessed 26 Jul 2026)

View author profile → · Editorial policy