We set out to answer a simple question about our own servers: how much data does this site send in a month? We have root on the machine. We run every service on it. We could not answer it, and the reason turns out to be more useful than the number would have been.
There are three places to look, and they disagree. The most authoritative-looking of them turns out to be measuring something else.
Three sources, three numbers
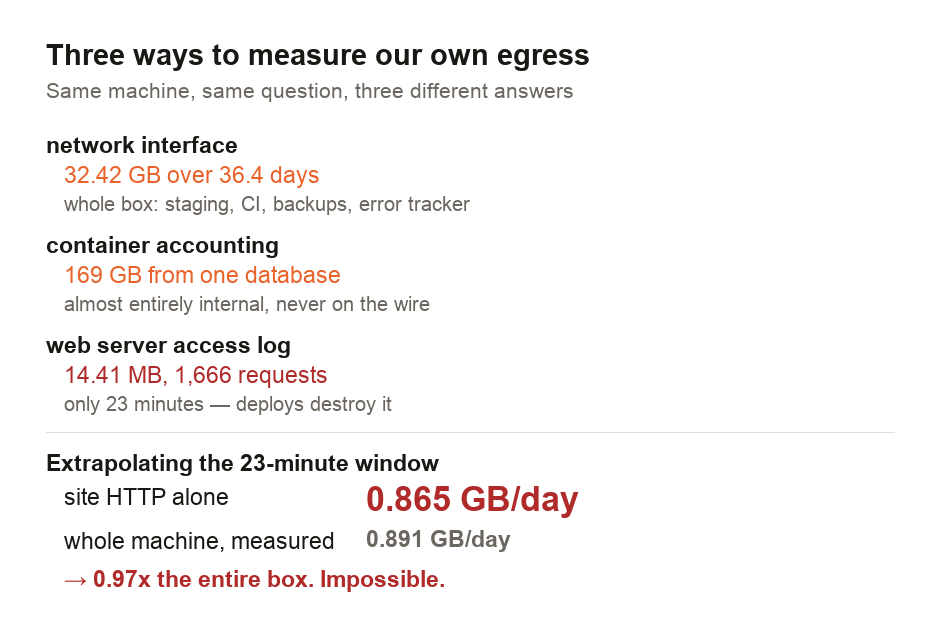
The first is the network interface itself. Linux keeps a running byte count per interface, and ours reports 32.42 GB transmitted over 36.4 days of uptime — about 0.891 GB a day.
That is a real measurement of real bytes leaving a real machine. It is also not our website. The same box runs the staging environment, a self-hosted error tracker, nightly database backups pushed to object storage, operating-system updates, and a continuous-integration runner that pulls container images. Every one of those is in the 32.42 GB.
The second place is per-container accounting. Docker tracks bytes in and out for each container, which sounds like exactly the attribution the interface counter lacks. Our production database container reports 169 GB transmitted — five times the entire machine's external traffic.
Both figures are correct. The database is talking to the application container over a virtual network that never touches the wire, and container accounting counts it. Almost all of that 169 GB is a conversation between two processes on the same host.
The precise source that forgets
The third source is the web server's access log. It records the exact byte count of every response, giving us the right unit-bytes served to actual visitors, per request, with the URL attached.
Ours held 1,666 requests totalling 14.41 MB, covering 23 minutes.
Twenty-three minutes, because the log lives inside a container that is destroyed and recreated on every deployment, and we had deployed twenty-three minutes earlier. The most accurate accounting we have is also the most short-lived, and nothing was misconfigured to make that true — it is the ordinary consequence of treating containers as disposable.
The arithmetic that disproves itself
The obvious move is to extrapolate. Twenty-three minutes of traffic, multiplied out to a day, then a month.
Do it and you get 0.865 GB a day of website traffic. Set that beside the interface counter's 0.891 GB a day and it says our public website accounts for 97% of everything the machine sends.
That is not arithmetically impossible — 0.865 is below 0.891 — but it is not credible. The same machine demonstrably runs continuous integration pulling container images, nightly backups leaving for object storage, and a staging environment. Those are not rounding errors, and together they will not fit in the remaining 3%.
So the extrapolation is wrong, and one comparison against the machine total is enough to show it. The twenty-three minutes we sampled were unrepresentative, because they immediately followed a deployment: our own health checks, a warm cache filling, and whatever crawler traffic happened to arrive. Multiplying a short window out to a month does not make it representative of one.
We were lucky that it failed so visibly. Had the sample extrapolated to 0.3 GB a day it would have looked entirely reasonable, rested on the same twenty-three minutes, and very likely been published.
The direction of the traffic gives it away
There is a second reading of the interface counter that settles the question without any attribution at all, and we nearly missed it because we were only looking at the outbound column.
The machine received 206.4 GB while sending 32.42 GB. It pulls in 6.37 times more than it puts out.
A web server should look like the opposite. Serving pages means receiving small requests and returning larger responses; the outbound column ought to dominate by a wide margin. Ours is inverted, and an inverted ratio is not a subtle hint — it says most of what this machine does over the network is fetch things, not serve them.
Which fits everything else we found. Continuous integration pulls container images and dependency archives on every push. The operating system fetches updates. The error tracker and the database pull too. Serving the actual website is, by volume, a minority activity on a box whose entire job description is serving the actual website.
That is worth holding onto when reading any single-server bandwidth figure, including the one on an invoice: unless the ratio leans outbound, the number is mostly describing something other than your visitors.
What we would need to answer it properly
The honest answer is that measuring your own egress needs infrastructure you have to decide to build, and none of the three sources above is it.
You need per-request accounting that outlives a deploy — logs shipped off the container, or a counter incremented somewhere durable. You need it attributed, so the website is separable from backups and CI. And you need it running long enough to cross a weekend, a traffic spike and a quiet week, because a Tuesday afternoon is not a month.
Cloud bills solve this by measuring at the boundary and charging you for it, which is a real service and worth remembering when comparing a managed platform against a machine you rent. We look at that trade in a companion guide on what our stack actually consumes.
Reading a figure like this when someone hands you one
Three questions are worth asking of any egress figure, including one on an invoice.
First, ask what the boundary is: machine, container, service, or request? Interface and container counters answer different questions, and neither measures just the website. Second, ask how long the window is; treat anything under a full week as a sample, not a rate. Finally, ask what else shares the meter. On a single-box deployment, the answer is usually "quite a lot."
If you want to convert whatever figure you end up with into the units a provider bills in, our data storage converter handles the gigabyte-versus-gibibyte problem that quietly moves totals by around 7%, and our percentage calculator is the quickest way to check a claimed share against a total — which is the check that caught our own extrapolation.
We could not measure our own site's monthly egress, with root on the machine. The interface counter says 32.42 GB over 36.4 days but covers staging, CI, backups and an error tracker. Container accounting reports 169 GB from one database, almost all of it internal. The access log is exact and 23 minutes old, because deploys destroy it. Extrapolating that window gives 0.865 GB a day for the site alone — 97% of the whole machine's traffic, leaving 3% for CI, backups and staging combined. Per-request accounting that survives a deploy is something you build on purpose; without it, be suspicious of anyone quoting a precise figure.
Sources and method
- All figures produced by
measure-infra.shin this repository, run against our production VPS. Raw output is committed asfacts-infra.json. - Interface counters read from
/proc/net/dev; the rate is derived against/proc/uptime. Container figures come fromdocker stats; access-log totals are summed from the response-size field. - ⚠️ Continuous-integration service containers are EXCLUDED by name. They are throwaways created by the self-hosted runner, and at the moment of measurement they held more memory than production — including them would have dominated every figure here.
- This measurement is NOT re-run by the wave guard: it needs the live host. Its numbers are pinned as recorded.
This guide reports measurements of our own infrastructure. It is educational and is not capacity-planning or procurement advice for any other system.

View author profile → · Editorial policy