One rented machine runs this entire company: the production website, a full staging copy of it, a self-hosted error tracker and the continuous-integration runner that builds and deploys everything. Four virtual CPUs, fifteen gigabytes of memory.
We measured what it actually consumes, because "it fits comfortably" is the kind of claim that stays true right up until it doesn't. It uses less than we expected, and the figure that stopped us belonged to something else running on the same box.
What production costs, in the units a machine understands
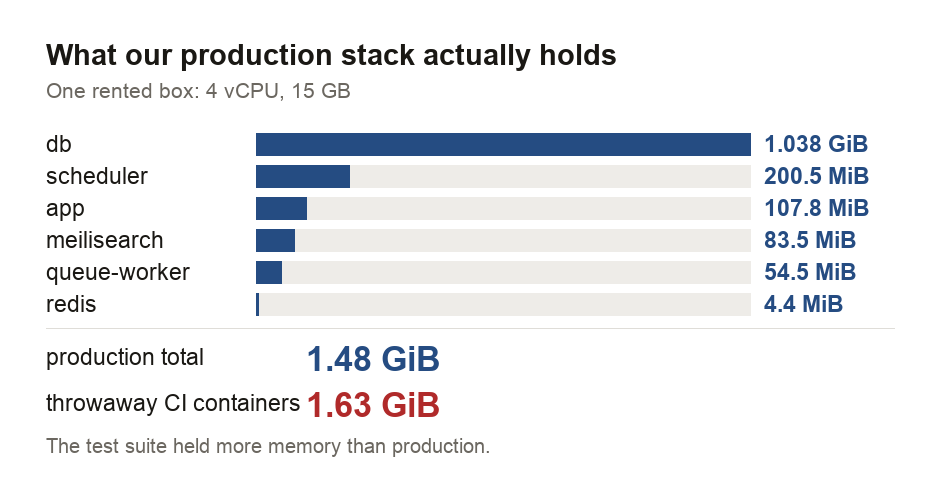
Production is six containers: the application, a scheduler, a queue worker, MySQL, Redis and Meilisearch. Together they hold 1.48 GiB of memory.
| Container | Memory |
|---|---|
| MySQL | 1.038 GiB |
| Scheduler | 200.5 MiB |
| Application (nginx + PHP-FPM) | 107.8 MiB |
| Meilisearch | 83.5 MiB |
| Queue worker | 54.5 MiB |
| Redis | 4.4 MiB |
The database is 70% of it. The thing that actually serves every page — nginx and PHP together — is 107.8 MiB, less than a browser tab. Redis, which holds the cache and the queue, is 4.4 MiB.
Add the staging environment's own six containers and the pair comes to 2.26 GiB: about 15% of the machine.
The containers that used more than production
At the moment we measured, three containers on the box held 1.63 GiB between them and were burning a full CPU core. They were not ours in any lasting sense: they were a throwaway MySQL, Redis and Meilisearch spun up by the continuous-integration runner to execute a test suite, due to be destroyed minutes later.
They were using more memory than production.
This is the trap in any snapshot of a shared machine, and it is easy to walk into with a straight face. Read the totals without checking names and you would conclude the stack needs twice what it needs, then provision accordingly. Our measurement script excludes them by name, and the reason is written into the script rather than left to whoever runs it next.
It also reframes the capacity question. The peak load on this machine is not our traffic — it is our own test suite, running on someone else's schedule, several times a day.
Production shares four cores with its own test suite
Memory is the dimension with room to spare. CPU is tighter, because those throwaway containers are not idle while they sit there.
At the moment of measurement those three CI containers were consuming 100.1% of CPU between them — a full one of the machine's 4 cores, or 25% of everything available. Production's containers read 134.4% at the same instant, but almost all of that was the single scheduler process discussed below, not the application serving pages.
Add them and roughly 59% of the machine was busy, with a quarter of it spent on a test suite. A visitor arriving mid-build is served by an application competing for the same silicon as our own CI. It has caused no visible problem — the application container itself is nearly idle — but this is the real capacity constraint here, and it is entirely self-inflicted. On a single box, our own build pipeline is often the heaviest thing running on the production server.
This argues for separating CI onto its own host long before upsizing the production tier-a nuance that's invisible if you only look at the server's total load.
What a snapshot cannot tell you
One reading of docker stats is an instant, and we want to be careful about what an instant supports.
Our scheduler container showed 125.4% CPU while every other production container sat near zero. That is not a scheduler problem; it is a cron job that happened to be running when we looked. Sample a minute later and the same container reads 0%.
So the memory figures here are meaningful — memory moves slowly and these processes are long-lived — while the CPU figures are close to anecdote. Capacity planning wants a distribution over days, not a reading. We are publishing the memory numbers with some confidence and the CPU numbers as an illustration of why you should not trust a single sample, including this one.
What the managed equivalent would have to be
The honest comparison is harder than a price lookup, and the reason is instructive.
A managed platform does not sell you 2.26 GiB. It sells discrete tiers, per service. Our six production containers become roughly five billable products: an application host, a managed MySQL, a managed Redis, a managed search index, and something to run scheduled jobs and queues. Each has a smallest available size, and the smallest available size is generally well above what our containers actually use.
Redis is the clearest case. Ours holds 4.4 MiB. The smallest managed Redis a provider will sell is typically measured in hundreds of megabytes, because nobody builds a product around four megabytes. You do not pay for what you use; you pay for the smallest unit they sell, times the number of services you have split into.
We are deliberately not printing a monthly figure. Provider prices move, vary by region, and the tier you would land on depends on redundancy and backup choices that are decisions rather than measurements — publishing one number would be publishing our assumptions with a currency symbol on them. What travels is the shape: fifteen per cent of one rented machine, split across five managed products each with a floor.
If you want to run that arithmetic for your own provider and region, our percentage calculator will do the headroom, and our data storage converter handles the gibibyte-versus-gigabyte gap that shifts memory tiers by around 7% — enough to cross a tier boundary.
What we would actually watch
Three numbers matter more than the total. First is the database's memory; at 70% of the footprint, it's the only part that grows with content, not traffic. Second is the peak load, not the mean, because our peak is a test suite, not a visitor. Finally, there's the headroom. At 15%, it's the reason a single box still works-not because it's cheap, but because the load fits. And that can change quietly.
The companion measurement to this one is what the same machine actually sends over the network, where the answer turned out to be that we could not measure it precisely at all.
Our whole production stack — six containers including database, cache and search — holds 1.48 GiB, of which MySQL is 70% and the part serving every page is 107.8 MiB. With staging alongside it, the pair uses about 15% of one 4-vCPU, 15 GB machine. The figure that surprised us was not ours: three throwaway CI containers held 1.63 GiB, more than production, which is exactly how a snapshot of a shared box misleads you. We publish no managed-equivalent price, because that number would be our assumptions rather than a measurement — what travels is the shape.
Sources and method
- All figures produced by
measure-infra.shin this repository, run against our production VPS; raw output committed asfacts-infra.json. - ⚠️ CI service containers are EXCLUDED by name from every stack total and reported separately. They are throwaways created by the self-hosted runner and at the moment of measurement held more memory than production.
- Memory figures are a single
docker statssample. Memory is stable for long-lived processes; CPU is NOT, and the 125% scheduler reading is presented as an artefact of sampling rather than a load figure. - No managed-platform price is quoted. Tiers, regions and redundancy choices are decisions rather than measurements, and this measurement cannot establish them.
This guide reports measurements of our own infrastructure. It is educational and is not procurement, capacity-planning or cost advice for any other system.

View author profile → · Editorial policy