Work out your carbon footprint anywhere and the answer arrives with a translation attached: so many kilometres driven, so many phone charges, so many trees.
The tree figure is the one people remember, but it carries a unit almost nobody notices.
The unit is not what it looks like
Our own calculators put a year of emissions at 1,000 kg against 47.62 trees. That figure comes from a mature tree absorbing 21 kg a year, so the arithmetic is a division and there is nothing wrong with it.
But the unit that division produces is the tree-year — one tree working for one year. That is a quantity of absorption, not a headcount of trees. Forty-eight tree-years could be forty-eight trees for a year, or five trees for a decade.
Read as a headcount, it becomes a promise the number was never making — that planting forty-eight saplings settles the year.
What a newly planted tree actually does
A sapling does not absorb at a mature tree's rate. The engine behind our tree calculator ramps a young tree up to full uptake over five years, and running the quoted 47.62 trees through it gives the honest schedule.
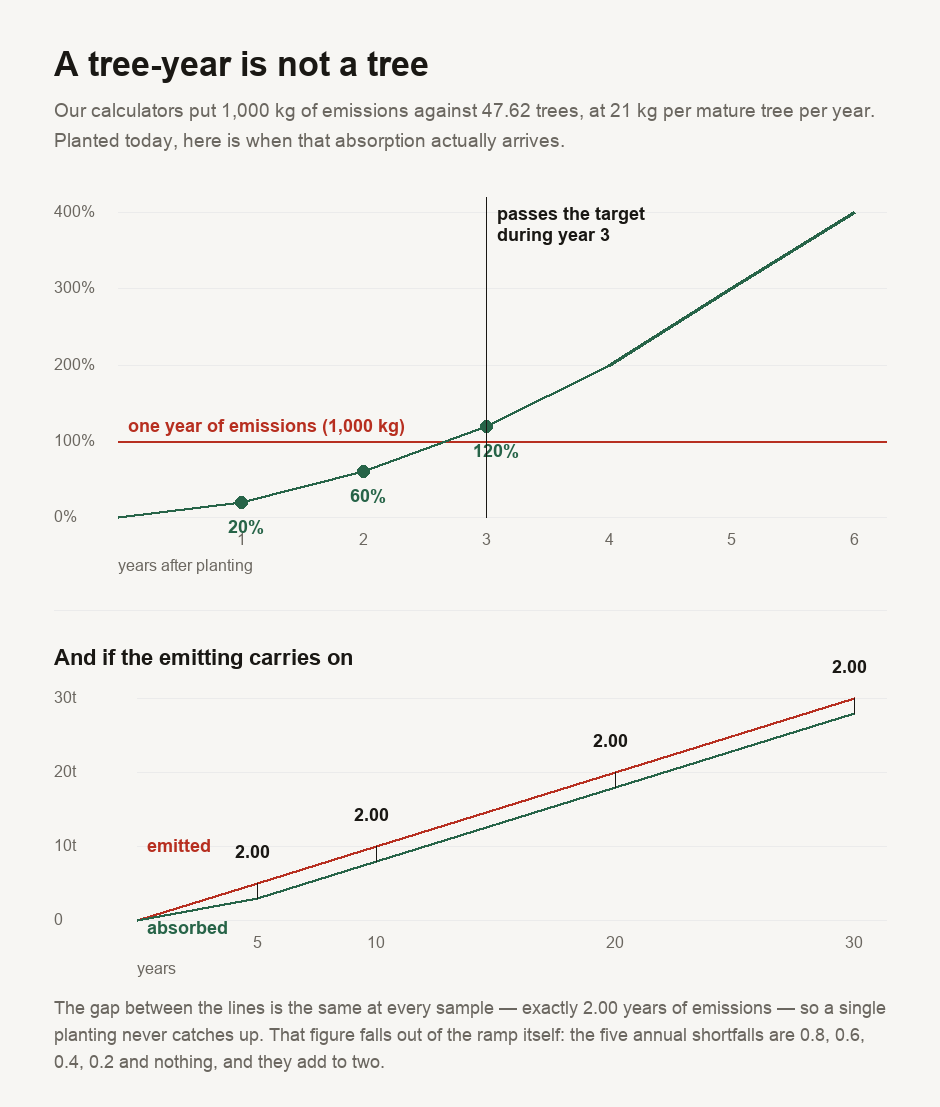
In their first year, those trees absorb 20 per cent of the emissions they were quoted against. By the end of year two the cumulative total is 60 per cent. It first passes one year of emissions during year 3.
So the planting works, just not as a payment made this year. And when the framing is "offset your flight", three years is no rounding error.
The part that does not close
The schedule above assumes you emit once and stop. Nobody does.
Plant the quoted trees, then carry on emitting the same amount annually, and the shortfall settles at exactly 2.00 years of emissions. After 5 years, after 10, after 20, after 30 — the same 2.00. The gap never closes.
The number is not a coincidence. It falls out of the model's ramp: the five annual shortfalls (0.8, 0.6, 0.4, 0.2, and 0) sum to two. Whatever your emissions, one planting leaves you two years behind, permanently.
The pattern holds for any amount of emissions. We checked at 500, 2,000, 5,000 and 12,000 kg; the break-even year, the first-year share and the settled deficit were identical.
What our own tools say, which is the good news
So we checked whether our own pages commit this error.
Seven of our calculators print this equivalence. 5 use the exact unit — "tree-years to absorb", "tree-years of absorption". The other 2 paraphrase it as "trees for a year" and "trees working a year to absorb it", which is looser but still says the trees work for a year.
None of the seven drops the time element, which is the failure that would have mattered. The dedicated tree calculator goes further still: it takes your target, walks the ramped growth curve, and marks the year the cumulative total actually reaches it.
We would have published the opposite finding had we found it. We looked for it specifically, and it is not there.
What the arithmetic still leaves out
Three other factors also work against the simple offset arithmetic.
The ramp is a model. Real growth depends on species, soil and climate and is not a straight line to maturity. The shape of the finding survives any plausible curve; the exact years belong to this one.
Trees die. A planted sapling that does not survive absorbs nothing at all, and mortality in the first years is not rare.
And carbon in wood is storage rather than disposal. It returns if the tree burns or rots, which is what "permanence" means in offset accounting and why it is the hardest part to guarantee.
How to read the number
Treat a tree figure as a description of scale, not a receipt. It tells you the size of your emissions in units of forest, which is a useful conversion.
If it appears in something you are being sold rather than something you are calculating, look for the year. An offset priced on mature uptake and delivered by saplings is charging you today's rate for a service that starts arriving in three years.
And the arithmetic points where it always points: an emission avoided needs no schedule at all.
A tree-year is one tree working for one year — a unit of absorption, not a headcount. Our own tools put 1,000 kg against 47.62 of them, and read as a headcount that becomes a promise the number never made. Planted today, those trees absorb 20 per cent of the target in their first year and only pass it during year three, because a sapling takes years to reach the mature rate the figure assumes. Keep emitting and one planting never catches up: the deficit settles at exactly 2.00 years and stays there at 5, 10, 20 and 30 years out. So treat the number as a description of scale rather than a receipt, and check what year an offset you are being sold is actually delivered in. This does not make planting trees pointless; it just makes them slow. An emission avoided, on the other hand, needs no schedule at all.
Running it yourself
The script is committed with this guide. Our tree planting CO₂ calculator is the one that models the growth curve rather than the flat rate, and it will show you the break-even year for your own target. The flight carbon calculator and diet carbon footprint calculator are two of the pages that print the tree-year equivalence, so you can see the unit in place. For what these numbers are made of, flying against driving takes apart a comparison that fails on units in much the same way, and solar payback on a tropical roof is the other end of the same question — what it costs to avoid the emission instead.
- Every figure is computed by a script committed alongside this guide, using
sustainability-kernel.js— the module our own carbon calculators run on. The mature uptake rate and the five-year growth ramp are the kernel's own, and nothing is quoted from an external forestry table. - ⚠️ THE FIGURES ARE SCALE-INVARIANT, AND THIS IS CHECKED RATHER THAN ASSUMED. The break-even year, the first-year share and the settled deficit are identical at 500, 2,000, 5,000 and 12,000 kg. The script fails if they ever diverge.
- ⚠️ THE RAMP IS A MODEL, NOT A MEASUREMENT. The kernel takes a young tree linearly to full uptake over five years. Real growth is species-, soil- and climate-dependent and is not linear. The shape of this finding survives any plausible curve; the exact years belong to this model.
- ⚠️ MORTALITY, LAND USE AND PERMANENCE ARE ALL OUTSIDE THIS, and all three push against the offset rather than for it. A sapling that dies absorbs nothing, and carbon stored in wood returns if it burns or rots.
- ⚠️ THE QUEUE'S PREMISE FOR THIS TOPIC DID NOT HOLD and the guide was reframed rather than forced. It proposed publishing the spread between three of our calculators run on one person; diet, commute and electricity measure different things and are complements, not competing estimates, so there is no spread.
- ⚠️ A SECOND HYPOTHESIS WAS TESTED AND REFUTED. Our own tools were expected to overstate offsets by quoting the flat mature rate as a headcount. They do not, and the check is run over the committed page scripts rather than asserted: 5 of 7 use the exact unit, 2 paraphrase it while keeping the year, and none drops the time element.
- ⚠️ THAT CONTROL WAS BROKEN TWICE BEFORE IT WAS RIGHT, which is worth recording because it nearly produced a false accusation against our own work. Its first pattern could not read past a bracket and returned nothing, which it counted as all seven pages failing. Its second demanded the literal hyphenated unit and flagged the two paraphrases, which was an overclaim. The check now asks only whether a time element survives, and an unreadable label is recorded as a broken instrument rather than added to the findings.
This works through the arithmetic of tree-based carbon equivalences using our own published model. It is not carbon accounting advice, not an assessment of any offset scheme or provider, and not a claim about what any particular planting will absorb.

View author profile → · Editorial policy