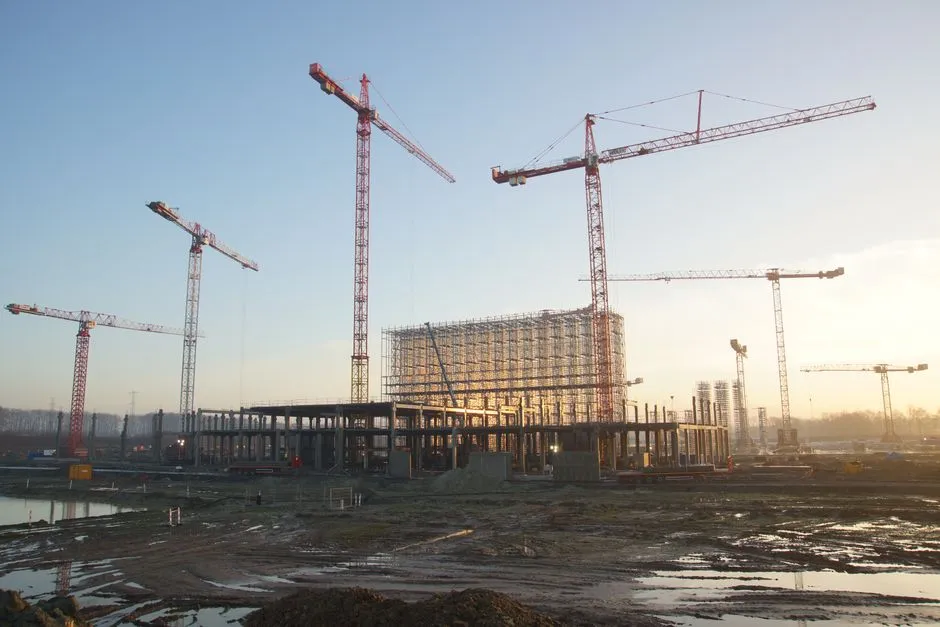
SINGAPORE, 22 AUG 2026 — Global data centre capital expenditure is on course to exceed US$1 trillion in 2026, according to Dell'Oro Group, as hyperscale AI deployment accelerates and rising memory and storage prices push server costs higher.
The five largest operators — Amazon, Microsoft, Google, Meta and Oracle — are projected to spend more than US$600bn between them, a 36 per cent increase on 2025, with roughly three quarters of that, about US$450bn, directed at AI infrastructure.
The figures
Two other numbers frame the trajectory. Analyst expectations for 2027 spending by the fourteen largest listed data centre developers rose 56 per cent between August 2025 and February 2026. And global AI data centre electricity consumption rose about 50 per cent in 2025 to roughly 485 TWh, with projections reaching 950 TWh by 2030.
Memory prices are inside this number, and that changes what it means
The most useful detail in the forecast is the one least likely to be quoted: part of the increase is price, not volume.
Rising memory and storage costs are named as a driver of higher server spending. That matters because a capex figure inflated by component prices describes a different situation from one inflated by capacity. Spending more to buy the same number of machines is cost inflation; spending more to buy more machines is expansion. The headline conflates them.
High-bandwidth memory pricing supports the first reading in part. HBM4 is estimated at around US$550 a stack against US$200 for HBM3, and HBM3E contract prices rose roughly 20 per cent in a quarter, with three suppliers and no substitute. An accelerator's memory is a large and growing share of its cost, so a given dollar of capex buys less compute than it did.
The 23 gigawatts under construction is the better volume proxy, because a gigawatt is a gigawatt regardless of what memory costs. Watching capacity and capex diverge is how you tell an expansion from a price shock, and right now both are rising.
A 56 per cent revision in six months is the more alarming statistic
Forecasts moving that far, that fast, describe an industry that does not know its own demand.
Analyst expectations for 2027 spending by the largest developers rose more than half in six months. This means one of two things: either the demand signal changed dramatically, or the August 2025 forecasts were simply wrong. The second is more likely; demand for infrastructure with multi-year lead times does not usually change by half in two quarters.
The practical consequence is that any number in this space carries a wide error bar that the presentation of it never shows. A trillion-dollar forecast made today has the same epistemic status as the 2027 forecast made last August, which has since been revised by 56 per cent.
This does not mean the figure should be ignored, but that it is better read as a direction of travel than a precise quantity.
Where the phantom-load problem fits
A separate finding this month sharpens the caution. Analysis reported in mid-August concluded that more than two thirds of the electricity requested for United States AI data centres will not materialise, with grid operators likely to commit to roughly 28 per cent of the 1,066 gigawatts requested.
Requested load is not built load. Developers often submit interconnection requests for multiple sites to keep their options open, but build at only one. This practice inflates any aggregate number based on applications rather than actual construction.
Capex forecasts are built from company guidance rather than from interconnection queues, so they are less exposed to that particular distortion. But the two datasets describe the same industry, and one of them says a large fraction of stated intent evaporates. A reader should hold the trillion-dollar figure alongside that.
What 485 terawatt hours actually compares to
The electricity number needs a reference point to be meaningful, and the doubling projection is the part worth taking seriously.
Roughly 485 TWh in 2025 rising to about 950 TWh by 2030 is a near-doubling in five years for a single application category. For scale, that trajectory approaches the annual electricity consumption of substantial industrialised economies, arriving on grids that were planned before anyone forecast it.
The regional consequence is not abstract. Every ASEAN market courting data centre investment is bidding for a share of that load, and each has a grid sized for the demand it expected. Thailand now requires large data centres to demonstrate power readiness before the state expands the grid to serve them; a proposed Philippine hub would need roughly 16 per cent of Luzon's entire grid capacity.
What this means for buyers rather than builders
For any enterprise buying cloud or accelerator capacity rather than building its own, the forecast has a direct implication for pricing.
Capital expenditure at this scale is recovered through pricing. A provider spending US$450bn on AI infrastructure will need to earn a return on that asset base. Today's capex, depreciated over the uncertain useful life of the hardware, becomes tomorrow's list price.
The negotiating implication is to be cautious about long commitments priced off current rates, in either direction. If capacity arrives faster than demand, prices fall and a long contract looks expensive. If memory constraints persist, the reverse. Whatever the outcome, the trillion-dollar figure shows the supply side is not standing still.
What remains unconfirmed
The forecast is Dell'Oro's and the methodology is not described in the material reviewed. The total is not broken down into price inflation versus volume growth — the one decomposition that would make the figure truly interpretable.
Whether the US$600bn hyperscaler figure is capital expenditure as reported in accounts or includes leases and other commitments is not stated, and the treatment of the uncommenced-lease obligations disclosed by hyperscalers earlier this month is not described. The 23 gigawatts under construction is not broken down by region or expected completion date, and the source and basis of the 485 TWh and 950 TWh electricity figures are not given.
What to watch for
That price-versus-volume decomposition is what to ask for. A total that separates price from volume would settle whether this is an expansion or an inflation, and its absence is the single biggest gap in the published figure.
Capacity completion is the second signal. If 23 gigawatts under construction converts into 23 gigawatts energised on schedule, the spending was real; if it slips, the phantom-load finding extends from interconnection queues into construction.
The third is the next revision. A forecast that has already moved 56 per cent in six months will move again, and the direction of that move says more than the current level does.

View author profile → · Editorial policy