Every guide about infrastructure eventually asks whether you need the cloud. Most of them answer with pricing pages. This one answers with a machine.
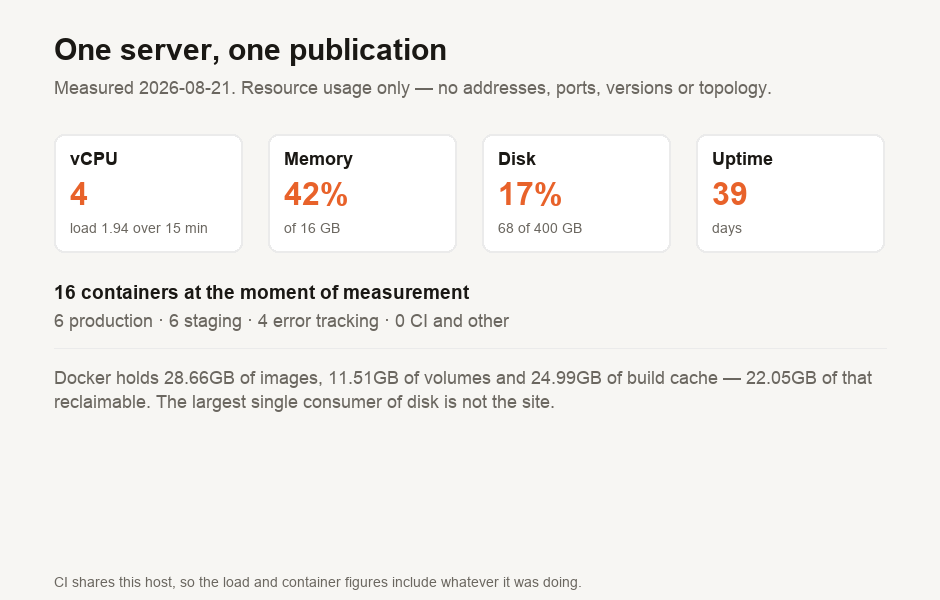
This publication — the live site, a full staging copy, an error tracker and its own CI runner — is one virtual server with four cores and 16 GB of memory. Here is what it actually uses.
The numbers
| Resource | Provisioned | In use |
|---|---|---|
| vCPU | 4 | load 1.94 over fifteen minutes |
| Memory | 16 GB | 42% |
| Disk | 400 GB | 68 GB (17%) |
| Uptime | — | 39 days |
That hardware serves 763 published articles and guides, 916 tools, an AI directory of 1,370 entries, and an analytics table holding 526,075 rows.
Where the disk actually goes
Of the 68 GB in use, the application's own data is a small part. Docker accounts for most of it: 28.66 GB of images, 11.51 GB of volumes, and 24.99 GB of build cache — of which 22.05 GB is reclaimable at any moment.
That last figure is the practical lesson of running your own box. A quarter of the disk is rubbish that accumulated from building images, and nothing tells you unless you look. On a managed platform it would either be someone else's problem or a line on an invoice.
What is actually running
Sixteen containers at the moment of measurement: six for production, six for the staging copy, four for error tracking.
That "at the moment of measurement" is a necessary qualification. Twenty minutes earlier the count was nineteen, because CI was mid-run and its containers exist only for the duration of a build. Any single reading of this machine includes however much CI happened to be doing.
The same contamination applies to the load figure, and more seriously. A one-minute load average sampled during a build tells you about the build. We recorded a one-minute load average of 3.12 and a fifteen-minute average of 1.94 on four cores. The fifteen-minute figure is steadier, but it is still not a clean measure of the site alone. Separating them properly would need per-cgroup accounting over time, which we have not done, so we are not claiming it.
The comparison people actually want
Staging is the interesting half. It is a complete second copy of production — its own database, its own search index, its own cache — and on a managed platform each of those is a billable service. Here it is six containers on spare capacity, and its marginal cost is zero because the box was already paid for.
The same is true of the error tracker and the CI runner. Self-hosting the error tracker was originally a compliance decision rather than a cost one: the privacy policy commits to processing in Singapore, and the obvious hosted options offer US and EU regions only. Cost was the accident, not the motive.
We are not going to convert that into a monthly saving figure, because an honest one would need a like-for-like specification, and every such comparison we have seen quietly picks a shape that flatters the conclusion the author already had.
When one server is the wrong answer
Being fair about this matters more than being clever about it. A single server has clear limits.
- It is a single point of failure. One box, one power supply, one hypervisor. Our answer is nightly off-site backups and an accepted recovery time measured in hours, which is a real trade rather than a solved problem.
- It does not absorb a spike. Four cores is four cores. A front-page traffic event is survived by the CDN in front, not by the origin.
- The work does not vanish, it moves to you. Patching, upgrades, disk pressure, certificate renewal and the 22 GB of build cache are all now your evenings.
- It stops making sense with a team. One person who knows the box is efficient. Five people sharing one box without the guardrails a platform provides is not.
What it does prove is narrow and worth stating plainly: an entire publication of this size fits comfortably inside four cores with more than half the memory and 83% of the disk still free. The default assumption that a real site needs a fleet is not supported by this machine.
If your reason for choosing a provider is where its regions physically are, how far away the cloud is from Singapore measures that from here — and how much of the internet the big clouds hold covers how much of the address space they occupy.
What is measured here
The host figures are measured on 21 August 2026 by a script in our repository, read from the running server: core count, memory, disk, uptime, load, the container census by project, and Docker's own disk accounting. Content counts come from the production database.
Deliberately absent: no addresses, no ports, no software versions, no hostnames and no topology. Resource usage and counts do not help anyone attack a machine; the other things do, and no guide needs them to make its point.
Single samples, on one day, on a shared host. The load and container figures include whatever CI was doing at that instant, and we have said where rather than smoothing it away. Nothing here is a benchmark, and a site with different traffic or heavier pages would fill this machine differently.

View author profile → · Editorial policy