
You are creating a server, or a bucket, or a database, and a dropdown asks you which region. Most people pick the one with a familiar name, or the one the tutorial used, and move on.
That dropdown is a latency decision, and the range inside it is larger than most people would guess. We measured it from a machine in Singapore: the closest region answers in under six milliseconds and the furthest takes more than sixty times as long.
What was measured, and from where
Most published latency tables are synthetic, or measured from a continent away. This one comes from our own production server in Singapore, which makes it a real answer to a real question: if your server is in Singapore, how far away is everything else?
The figure is the TCP connect time — the handshake alone, one round trip to the region's front door. Not ping, which many networks deprioritise or drop, and not time-to-first-byte, which includes the service doing work. Each endpoint was probed five times and the median kept.
| Region | Where | Median | Times Singapore |
|---|---|---|---|
| aws ap-southeast-1 | Singapore | 5.8 ms | 1× |
| gcp asia-southeast1 | Singapore | 7.9 ms | 1.4× |
| aws ap-southeast-3 | Jakarta | 22.7 ms | 3.9× |
| aws ap-east-1 | Hong Kong | 38.8 ms | 6.7× |
| aws ap-south-1 | Mumbai | 65.1 ms | 11× |
| aws ap-northeast-2 | Seoul | 71.9 ms | 12× |
| aws ap-northeast-1 | Tokyo | 72.8 ms | 13× |
| aws ap-southeast-2 | Sydney | 95.4 ms | 16× |
| aws eu-central-1 | Frankfurt | 168.3 ms | 29× |
| aws us-west-2 | Oregon | 202 ms | 35× |
| aws us-east-1 | N. Virginia | 291.4 ms | 50× |
| aws sa-east-1 | São Paulo | 365.6 ms | 63× |
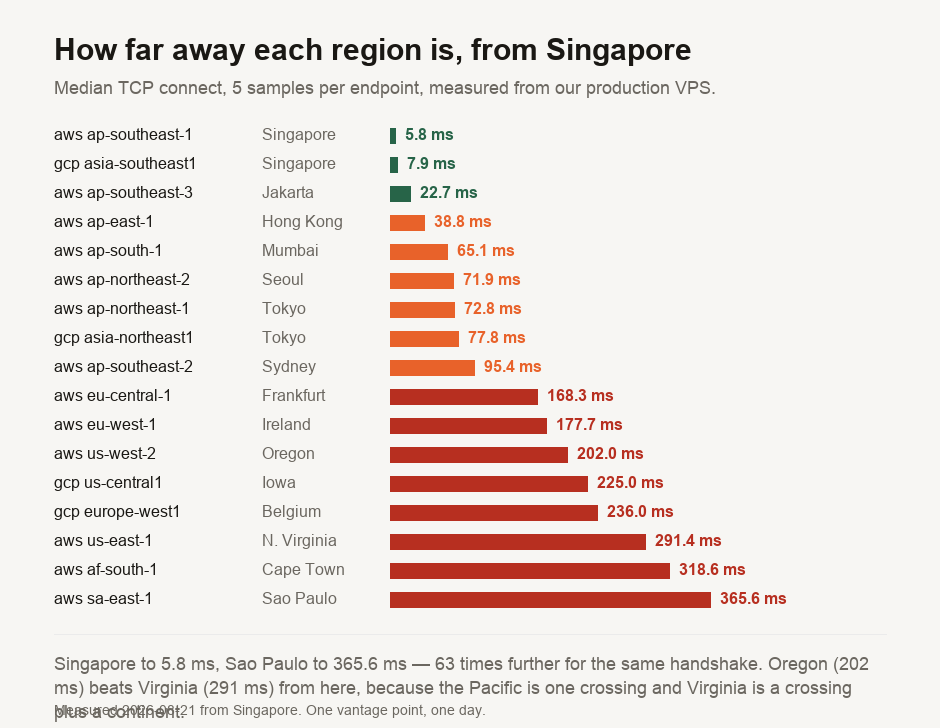
Three things the table shows that a map does not
The nearest neighbour is already four times further. Jakarta is a ninety-minute flight from Singapore and 22.7 ms away — nearly four times the local region. Regional does not mean local.
Oregon is much closer than Virginia. 202 ms against 291.4 ms, and the reason is that from Singapore the American west coast is a Pacific crossing, while the east coast is a Pacific crossing plus a continent. If you are serving Asia from a single US region and defaulted to us-east-1 because everything defaults to us-east-1, that is roughly 89 ms you are paying for nothing.
Frankfurt beats Ireland from here, at 168.3 ms against 177.7 ms, the opposite of what a map of Europe suggests. Cable routes decide this, not distance.
What a round trip actually costs you
Latency is not one round trip. A cold HTTPS request is a DNS lookup, then a TCP handshake, then a TLS negotiation, then the request itself — several round trips before a byte of your content moves.
At Singapore's 5.8 ms that overhead is invisible. At São Paulo's 365.6 ms, four round trips burn most of a second before any work is done. It is also why a chatty application — one that makes several sequential calls to a database in another region — degrades so much more than a simple one. Each call pays the distance again.
What this does not tell you
A latency number measures a path, not a provider. A slow figure can mean a distant region, a poor transit route on the day, or a front door that terminated the connection somewhere other than the region on the label. Our Seoul samples ranged from 71.2 ms to 106.2 ms while Mumbai stayed inside a single millisecond, and that spread is about the route rather than about Korea.
It is also not a measure of throughput. A high-latency link can still move a great deal of data once it is going; latency governs how quickly a transfer starts, which is what interactive applications actually feel.
How to use this
- Put the database next to the application. Cross-region database calls are the most expensive mistake on this list, because applications make many of them per request.
- Measure from where your users are, not from your laptop. The method here is one command; run it from a box in your own market and you will get your own table.
- Do not assume the default.
us-east-1is the default in an enormous amount of documentation and it is the second-slowest region we measured from here. - Separate what needs to be close from what does not. Backups and batch jobs can live anywhere. Anything a person waits for should not.
If you are weighing regions against running your own hardware, what one server actually runs covers the other side of that decision, and how much of the internet the big clouds hold counts the address space those regions answer from.
What is measured here
The latency figures are measured on 21 August 2026 from our production VPS in Singapore, using curl's TCP connect timing against regional storage endpoints, five samples per endpoint with the median kept and the minimum and maximum recorded. Seventeen regions across two providers responded; the script is in our repository.
These are one vantage point on one day. Internet routing changes, providers add capacity, and a measurement from Jakarta or Manila would produce a different table with the same shape. The ordering of anything separated by more than about twenty milliseconds is stable; the ordering of Seoul against Tokyo, nine tenths of a millisecond apart in our samples, is not.

View author profile → · Editorial policy