
A small exporter in Jakarta raises an invoice in January for USD 10,000, on sixty-day terms that become ninety in practice. The customer pays in August. The work was the same, the price was the same, and the money that arrived was 10.8 million rupiah more than the invoice was worth on the day it was written.
That is not a particularly good year or a bad one. It is an ordinary one, and that gain is a part of pricing most small businesses in the region never put a number on.
What the year actually did
These are the European Central Bank's daily reference rates for the five ASEAN currencies it publishes, from 2 January to 20 August 2026 — 162 business days.
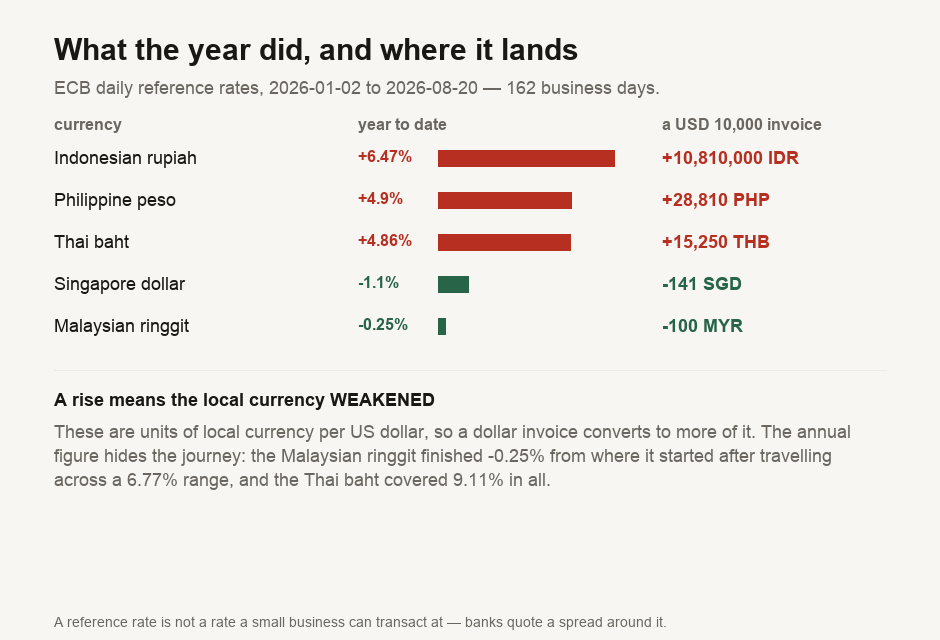
One thing to fix in your head before the table, because it is the main source of confusion about currency rates — what they actually represent. These are units of local currency per US dollar. When the number goes up, the local currency has become weaker, and a dollar invoice converts to more of it.
| Currency | Year to date | What that means | Widest range | Biggest single day |
|---|---|---|---|---|
| Indonesian rupiah | +6.47% | weakened | 8.58% | 1.11% |
| Philippine peso | +4.9% | weakened | 7.43% | 1.41% |
| Thai baht | +4.86% | weakened | 9.11% | 2.25% |
| Malaysian ringgit | −0.25% | strengthened | 6.77% | 1.36% |
| Singapore dollar | −1.1% | strengthened | 2.89% | 0.92% |
The same invoice, five countries
A USD 10,000 invoice raised on the first business day of the year and settled on the last day we measured:
| If you bank in | Worth in January | Received in August | Difference |
|---|---|---|---|
| Indonesia | 167,160,000 | 177,970,000 | +10,810,000 |
| Philippines | 588,470 | 617,280 | +28,810 |
| Thailand | 313,900 | 329,150 | +15,250 |
| Malaysia | 40,540 | 40,440 | −100 |
| Singapore | 12,863 | 12,722 | −141 |
If you earn in dollars and spend locally, three of those five went your way this year. If you pay in dollars — for cloud hosting, for software, for imported stock — the same three went against you, by the same amounts.
That symmetry is the point. A currency movement is not a cost or a windfall in itself; it is a transfer of value between the two sides of every cross-currency arrangement, and which side you are on is decided by how you invoice, not by how the year went.
The number that matters more than the trend
The year-to-date figure is the one people quote, and it is the less useful one.
Look at the ringgit: it finished the period almost exactly where it started, down 0.25%, while travelling across a 6.77% range in between. A business reading only the annual figure would conclude the ringgit did nothing in 2026. One that happened to invoice near the low point and get paid near the high point felt that 6.77% instead.
The baht is the sharper case. Its widest range was 9.11%, and its worst single day moved 2.25% — more than a typical net margin on a wholesale order, in one day, with nothing you could have done about it.
The Singapore dollar is the outlier in the other direction, with a tight 2.89% range and the lowest daily volatility of the five. That stability is characteristic of a currency managed against a trade-weighted basket, and part of why so much regional invoicing is denominated there.
What to do with this
- Price the terms, not just the product. Ninety-day terms on a dollar invoice is a ninety-day currency position you did not ask for. If your margin is thinner than the range in the table above, the terms matter more than the price.
- Invoice in the currency of your costs where you can. A business whose staff and rent are in rupiah, invoicing in rupiah, has no exposure to any of this. The risk comes from the mismatch between the currency you earn and the currency you spend, not from the currency itself.
- Ask what your bank's spread actually is. None of the rates here are available to a small business. The bank quotes a margin around the reference rate, and for retail-sized transfers that margin is often wider than the whole year's drift. If you measure the drift and ignore your bank's spread, you are tracking the smaller number and missing the larger one.
- Size the exposure before buying protection. Forward contracts and multi-currency accounts have costs. On a 2.89% range they may not be worth it; on a 9.11% range with thin margins they may be. The table tells you which conversation you are having.
- Re-run this yourself. The script is in our repository and the data source is free and needs no key. Your currencies and your terms will give a different table.
If your dollar costs are mostly cloud infrastructure, what one server actually runs covers the other half of that bill.
What is measured here
The rates are the European Central Bank's daily reference rates, retrieved through Frankfurter on 21 August 2026, covering 2 January to 20 August — 162 business days. The script refuses to emit results if any currency is missing on any day in the range, so a partial series cannot become a table.
A reference rate is not a rate you can transact at. Banks and payment processors quote a spread around it, and for small transfers that spread is frequently larger than the movements described here. Every figure above understates what a real business experienced, and understates it in the direction of making currency look cheaper to ignore than it is.
The ECB publishes on business days, so weekends and holidays are absent rather than flat — which is why the observation count is stated rather than a number of calendar days. Nothing here is a forecast. It is a record of what already happened to five published series, and past movement carries no information about future movement.