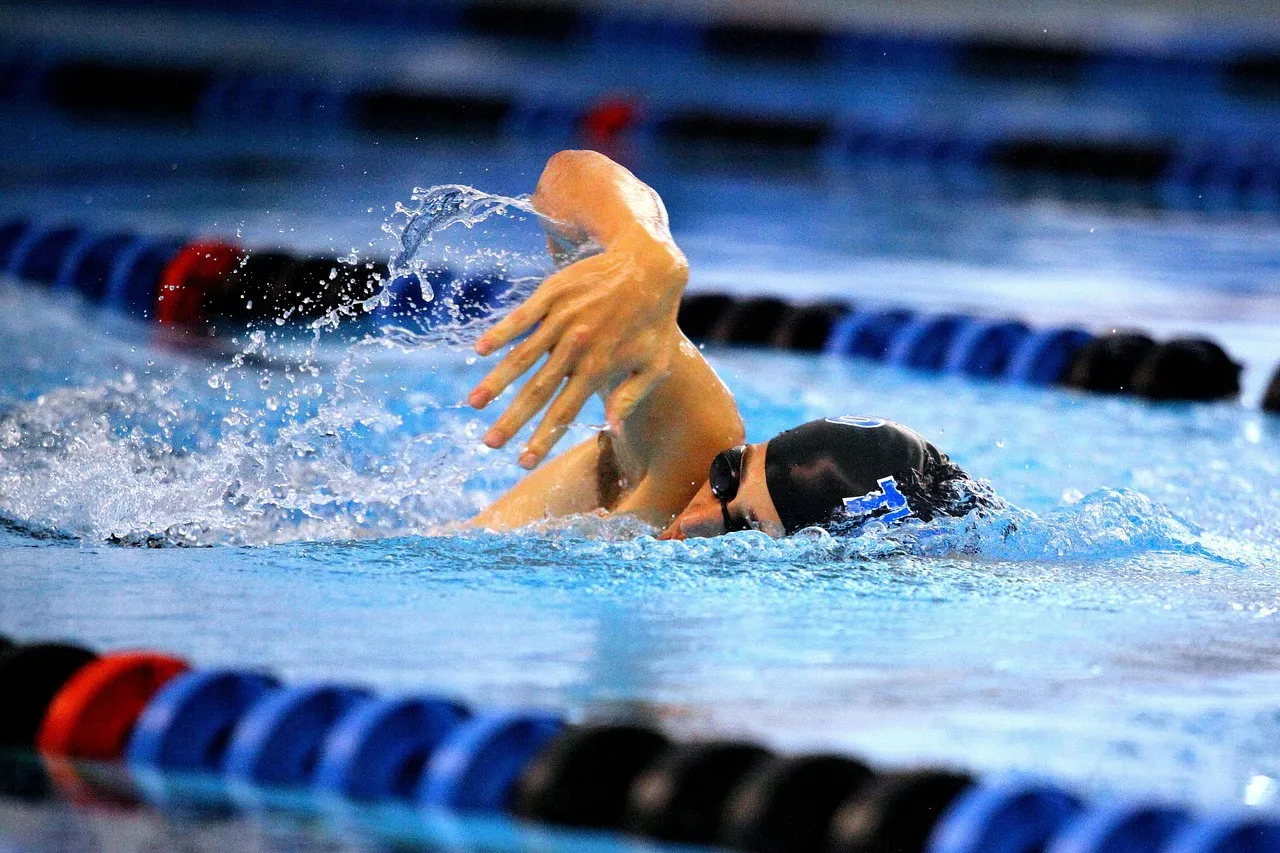
Swimmers compare times across three kinds of pool: 25 yards, 25 metres and 50 metres. A 25-yard pool is 22.86 metres long, and that one fact carries most of any yards-to-metres time factor. Of the 11% that the familiar 1.11 multiplier adds, plain distance (25 ÷ 22.86 = 1.0936) supplies 85%, by our arithmetic. Two US bodies, the NFHS and the NCAA, publish such factors, and across the six same-distance freestyle factors on the NFHS chart, distance supplies 79–87%. The rest, 1.3–2.3% per metre on same-distance events, is what the factors imply about racing in the shorter pool. The NFHS and the NCAA convert the same 400 m swim three and a half seconds apart, and both say their factors serve seeding and selection.
Pool length sets the face value of the yard-to-metre exchange
A yard is defined as exactly 0.9144 m, so four lengths of a 25-yard pool make 91.44 m. We split each published factor into two parts: the distance ratio between the two events, and the per-metre ratio left once distance is divided out.
| Published factor | Value | Distance ratio | Left over, per metre |
|---|---|---|---|
| NFHS, 50 yd to 50 m, boys | 1.119 | 1.0936 | metre pool 2.32% slower |
| NFHS, 100 yd to 100 m, girls | 1.112 | 1.0936 | metre pool 1.68% slower |
| NFHS, 200 yd to 200 m, both | 1.108 | 1.0936 | metre pool 1.32% slower |
| NFHS, 400 m to 500 yd, girls | 1.140 | 1.143 | yard event 0.26% faster |
| NCAA 2025-26, 25 m to 25 yd, other events | 0.906 | 0.9144 | yard pool 0.92% faster |
| NCAA 2025-26, 400 m to 500 yd | 1.153 | 1.143 | yard event 0.87% slower |
The distance ratio is pure geometry, and neither body says what the per-metre remainder stands for.
On same-distance events the NFHS chart prices in up to 2.3% per metre
The NFHS Swimming and Diving Distance Conversion Chart, dated 3 January 2017, gives eleven events per sex, each with a factor in both directions. It "may be used for seeding and qualifying times but not national records", the chart says.
Over the 14 individual events swum at the same distance in both courses, the per-metre remainder runs from 1.32% to 2.32%, always with the metre pool slower. That fits a yard pool having more walls per metre, but the chart gives no reason and we attribute none.
The 500-yard and 400-metre pair behaves differently. Those events are 457.2 m and 400 m, and once distance is divided out the sign flips: the girls' 1.140 leaves the yard event 0.26% faster per metre, the boys' 1.139 leaves it 0.35% faster. "1–2% per metre" describes the same-distance rows only.
The NCAA quotes a dearer rate on NFHS's own 400 m example
The NFHS chart works one example: a girls' 400 m freestyle in 4:27.47, times 1.140, gives a 500-yard time of 5:04.92. The NCAA's Division I Swimming and Diving Qualifying Standards for 2025-26 use 1.153, carry the arithmetic to five decimal places, then drop everything below a hundredth "without rounding". That gives 5:08.39, 3.47 seconds slower. Distance alone gives 5:05.72, between the two. The NCAA document adds that its table "does not reflect what is included in the NCAA Swimming and Diving Rules Book".
The 7 November 2026 version of our swimming pace calculator has a Yards ↔ metres view that opens on that NFHS example, a girls' 400 m in 4:27.47, and sets the three readings side by side, 3.47 s apart at the extremes. Earlier versions worked in metres only. Their pace tiles could read "0:60.0", which is what 1,500 m in 29:59 showed per 50 m. Their splits stopped at 2,000 m on longer swims and could miss the entered time, so that 400 m in 10:01 ended on 10:01.2.
A yard pool fits more lengths into every hundred metres
A 50 m pool takes two lengths per 100 m, a 25 m pool four, and a 25-yard pool 4.374. A 1,500 m swim is 30, 60 or 65.6 lengths; the 1,650-yard race, 1,508.76 m, is 66. Counting yard lengths as 25 m each overstates distance by 9.36%, so the pace reads 8.56% faster than the one swum.
The British Rankings regulations on Swim England's site, under a "British Rankings Policy" of February 2020, include swims "from 25m, 33.3m and 36.6yds" in short-course rankings and exclude pools "with multiple lengths less than 100m", naming 25, 33.3 and 50 yards. They state the rule only. By our arithmetic, three lengths of either included odd pool make about 100 m, while no whole number of lengths in the excluded ones comes within 8 m. Between 25 m and 50 m pools, the Swim England East Region Long Course Championships 2026 accept long-course conversion times "using Sportsystems time converter only", a method we do not describe.
World Aquatics' length tolerance is small change over 1,500 m
The World Aquatics World Record Validation form in force from 1 October 2025 allows a 50 m or 25 m pool "+0.010, and -0.000 metre when touch panels are installed": up to a centimetre long, never short. Its pool certification form sets the bare wall-to-wall length at 50.020–50.030 m before the panels go in.
At the full centimetre, a 1,500 m swim runs 0.30 m long in a 50 m pool or 0.60 m in a 25 m pool. At 1.5 m/s that is at most 0.20 s or 0.40 s, on our arithmetic, against the 8.56% that a miscounted yard pool puts into a pace.
Wakayoshi's two-swim test reads speed off a straight line
In a 1992 flume study, Wakayoshi and colleagues took critical swimming velocity as the slope of distance against time over swims to fatigue at six set speeds; among nine trained college swimmers it ranged from 1.062 to 1.262 m/s. Their 1993 paper used two swims, a 200 m and a 400 m, taking "the slope of the line connecting the two times", which it called "this new simple method". In a 4 × 400 m swim at that speed, its eight swimmers' blood lactate held near 3.2 mmol/l from the first stage to the third.
Speed is 200 ÷ (T400 − T200), so pace per 100 is (T400 − T200) ÷ 2. On our example inputs of 3:05 and 6:30, that is 0.9756 m/s, 1:42.5 per 100 m, and the line meets zero time at 19.5 m. The answer is per 100 of the pool's unit: the same two times swum over 25 yards are 1:42.5 per 100 yards, or 1:52.1 per 100 m.
Critical speed kept its value for well under an hour in Dekerle's trials
The 1993 abstract defines the speed as one that "could theoretically be maintained forever without exhaustion". Dekerle and colleagues tested that in a 2010 study of nine competitive male swimmers, taking critical speed from four all-out efforts of 100, 200, 400 and 800 m. Swum continuously, it "could only be maintained for 24.3+/-7.7 min". Ten 400 m blocks at that speed, with 40 s rest between them, took 53.9 minutes on average, and lactate stayed steady through them. Their speed came from four distances, so it does not measure how long a two-swim 200 and 400 figure lasts.

View author profile → · Editorial policy