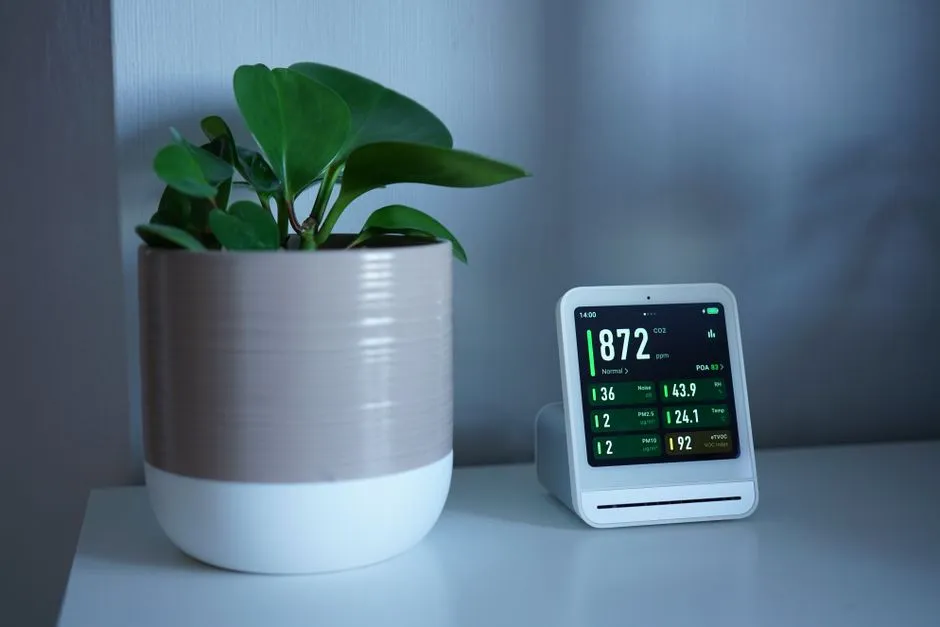
Almost every carbon dioxide monitor sold for homes, offices and classrooms turns amber somewhere around 1000 parts per million. The number appears in school guidance, in building handovers, in the marketing copy for the sensors themselves, and it is usually attributed to ASHRAE.
ASHRAE has spent years saying, in print, that this is not theirs. Their 2025 position document on indoor carbon dioxide is blunt about it: despite many statements to the contrary, their ventilation standard does not provide a limit value for indoor CO2.
Where the number actually comes from
Max von Pettenkofer, a German hygienist, proposed 1000 ppm in the 19th century as a marker of inadequate ventilation, with 700 ppm for bedrooms. ASHRAE's document names him and dates the figure to his era.
The document also explains what Pettenkofer's figure was measuring, and it is the perception of human body odour by the people in the room. It was a proxy for whether a space smelled stuffy to someone walking into it. It has been used for decades, as ASHRAE puts it, without an understanding of that basis.
The standard did carry a 1000 ppm limit once. The 1989 edition of ASHRAE Standard 62 had one, and later editions removed it — specifically because it was being misread, which is a fairly unusual thing for a standards body to say about its own withdrawn clause. Removing it did nothing to slow the number down.
For scale, the occupational exposure limit is 5000 ppm as an eight-hour average, with a 30,000 ppm short-term limit. The line your monitor calls dangerous is a fifth of the level a workplace may legally sustain all day.
Europe writes the rule a different way, and that changes everything
The European standard EN 16798-1 also gives CO2 criteria, in four categories. Its numbers look smaller than the folk rule:
- Category I, high expectation — 550 ppm
- Category II, normal expectation — 800 ppm
- Categories III and IV — 1350 ppm
They are not smaller. They are measured from a different zero. Each figure is a concentration above outdoors, not an absolute reading, and outdoor CO2 is not a constant.
NOAA's globally averaged marine surface annual mean for 2025 is 425.62 ppm. Add it:
| EN 16798-1 category | ppm above outdoors | Absolute reading, 2025 |
|---|---|---|
| Category I | 550 | 975.6 ppm |
| Category II | 800 | 1225.6 ppm |
| Category III / IV | 1350 | 1775.6 ppm |
The ubiquitous 1000 ppm line lands between the top two categories. Two consequences you can see on a monitor this afternoon:
- A room reading 990 ppm passes the 1000 rule and fails Category I.
- A room reading 1100 ppm fails the 1000 rule and sits comfortably inside Category II, the band the standard describes as normal occupant expectation.
How we satisfied ourselves that the European figures really are differentials
This matters enough to check rather than assume, and the standard itself sits behind a paywall. So we tested it against physics instead.
EN 16798-1 pairs each category with a design airflow as well as a CO2 figure: 10 litres per second per person for Category I, 7 for Category II, 4 for Category III. At steady state, the CO2 a room settles at above outdoors is the amount people exhale divided by the amount of outdoor air supplied. Turn that around and each category implies a value for how much CO2 one person produces.
| Category | ppm | L/s per person | Implied CO2 per person |
|---|---|---|---|
| I | 550 | 10 | 0.00550 L/s |
| II | 800 | 7 | 0.00560 L/s |
| III / IV | 1350 | 4 | 0.00540 L/s |
Take them as differentials and all three categories describe the same person: 0.0054 to 0.0056 litres per second, a spread of under four per cent, with the average landing on the standard figure for a seated adult. The absolute reading demands that the same person produce CO2 at rates three times apart depending on which category you consult. Only one of these describes a human being.
The rule is going to swap sides, and there is a date on it
An absolute threshold changes its meaning as the baseline underneath it moves. The 1000 ppm rule and Category I coincide when outdoor CO2 reaches 450 ppm, because 1000 minus 550 is 450.
NOAA's growth rates for the last ten years average 2.533 ppm a year. From 425.62 that is 24.4 ppm to go, or about 9.6 years.
⚠️ So from roughly 2035, the folk rule becomes the more permissive of the two. Rooms that pass 1000 ppm will start failing Category I. The rule will not have changed, but the baseline under it will have.
The same drift has been running in the other direction for much longer. The airflow needed to hold a room at a given reading depends on the gap between indoors and outdoors, so as outdoor CO2 rises, holding indoors at 1000 demands more fresh air, not less. Against a 19th-century outdoor level of about 286 ppm, the gap was 714 ppm; today it is 574. That is 24 per cent more outdoor air per person to achieve the same number on the display. By 2035 it will be about 30 per cent. No committee chose that tightening — it is a side effect of writing the rule as an absolute.
What to do with your monitor
Keep using it. CO2 is a good proxy for how much of the air in a room has already been through somebody, which is worth knowing for reasons that have nothing to do with CO2 being toxic.
Change the arithmetic you do with the reading. Take a measurement outdoors, or near an open window, and subtract it from your indoor figure. That difference is what the standards are about, and it is a number that stays comparable from one year to the next. On a typical day that will be somewhere near 420 to 450 ppm outdoors, so an indoor reading of 900 is a rise of roughly 460 — mid Category I, and better than the raw number suggests.
If you are sizing ventilation rather than watching a display, the number to design against is the airflow per person, not a concentration at all. Our aircon sizing calculator works in cooling load rather than fresh air and will not do this for you, and our carbon footprint calculator is about emissions rather than room air; the conversion above needs nothing more than the unit converter and the outdoor figure you just measured.
Where this comes from, and what will date it
Pettenkofer's attribution, the 1989 limit and its removal, the body-odour basis, the statement that the current standard sets no limit, the European categories and the occupational limits were all read from ASHRAE's own position document on indoor carbon dioxide, approved in February 2025. The outdoor concentrations and growth rates are NOAA's globally averaged marine surface series, and every conversion above is arithmetic on those two sources.
Two limits apply here. The European figures reached us through ASHRAE quoting the European standard rather than from the standard itself, which is why we tested them against the airflow pairings instead of taking them on trust. And the 19th-century outdoor concentration is the shakiest number here: the ice-core compilation we consulted returns 316 ppm for 1859 and 286 for 1862 from two different underlying studies, thirty parts per million apart in three years. We have used the lower figure and named it rather than averaging two numbers that disagree.
The crossing date moves if growth rates move, in either direction, and it is computed from a ten-year average that includes an unusually high 2024. Treat 2035 as the middle of a range rather than a deadline. Everything else here is stable: the history is history, and a standard that says it sets no limit is unlikely to start.

View author profile → · Editorial policy