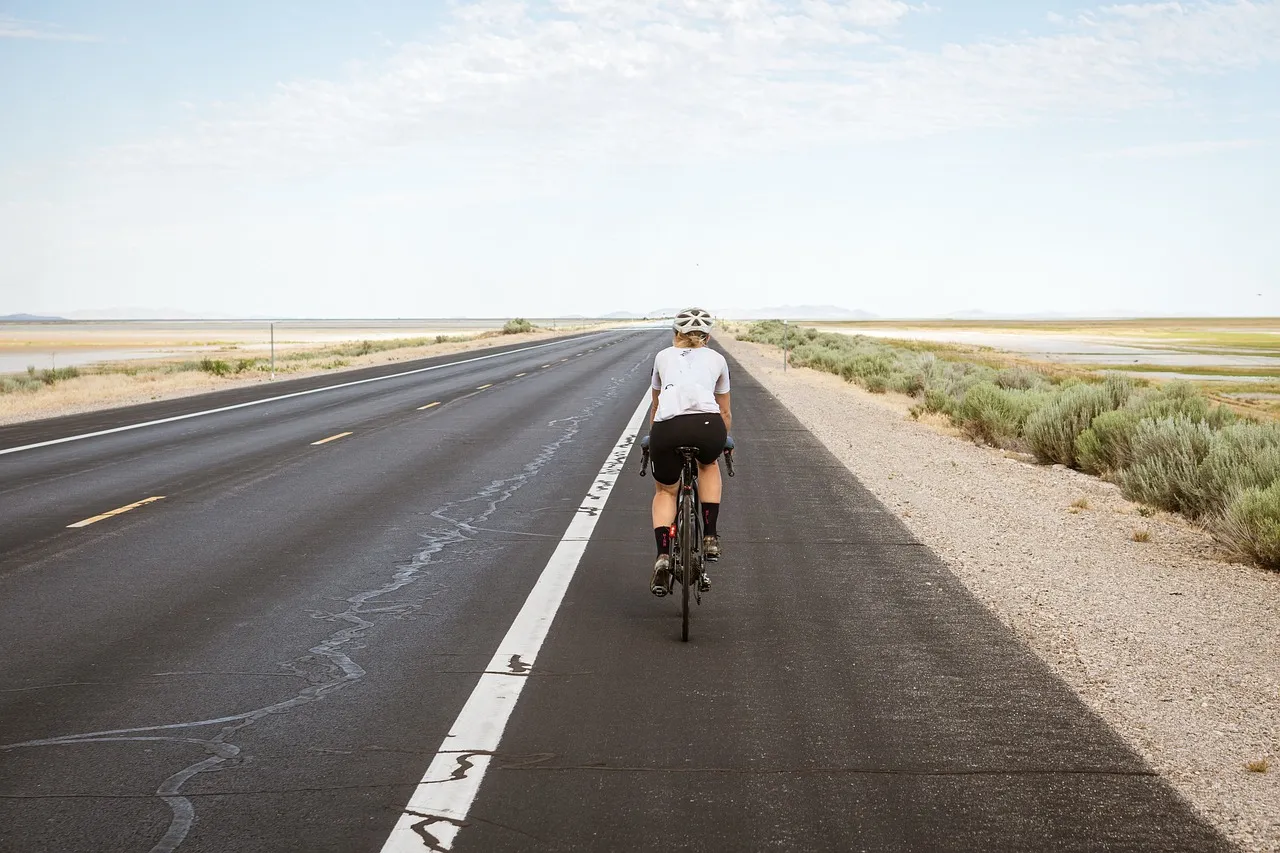
The power a cyclist has to find is the sum of what the tyres, the air and any gradient take. We ran the standard equation for it across flat roads, climbs and wind, with air density worked out from published climate normals. Under ordinary assumptions, 32 km/h on flat ground in still air takes about 178 W, and about four-fifths of what reaches the wheel goes into the air. A 15 km/h head wind, our chosen example, nearly doubles that to 342 W. Singapore's warm, humid air takes off 7.5 W compared with the textbook default. All of this rests on assumed values for drag and rolling resistance, and those are the weak point.
Air consumes about four-fifths of the power on a brisk flat ride
The model first sums the forces from rolling resistance, gravity, and air drag. It multiplies that total by ground speed to get power at the wheel, then divides by drivetrain efficiency to find the power required at the legs. It is a steady-state simplification of the road cycling model Martin and colleagues validated in 1998.
Our baseline is a 70 kg rider on a 10 kg bike, air density 1.225 kg/m³, and three assumptions: CdA (drag area) 0.32 m², Crr (rolling coefficient) 0.005 and drivetrain efficiency 97%. Shares below are of wheel power, and they are model outputs. Nobody's ride was measured.
| km/h | Legs (W) | Air | Rolling |
|---|---|---|---|
| 15 | 31 | 46% | 54% |
| 32 | 178 | 80% | 20% |
| 40 | 322 | 86% | 14% |
The 80% moves with its inputs: plausible pairs of CdA and Crr put it anywhere from 66% to 88%. Debraux and colleagues put air at about 90% of mechanical power on level ground above 14 m/s. At 50.4 km/h we get 91% of wheel power and 88% at the legs, which is agreement at one set of inputs.
Tyres claim the larger share below 16 km/h
Rolling power rises in step with speed. Air power alone rises with the cube of speed, so at our inputs the two cross a little above 16 km/h, and across plausible inputs anywhere from about 11 to 23 km/h.
That cube describes the air term on the flat and nothing else. Total power follows speed to the power 2.2 to 2.8 between 20 and 45 km/h, by our calculation.
Crr is less fixed than one number implies. Grappe and colleagues measured it "decreasing 62.4% from 150 kPa to 1200 kPa" of tyre pressure, and an added 15 kg raised it 11.4%.
Gravity takes most of the power on a 5% climb
Gravity's force ignores speed, so it takes over early, passing half of wheel power at a grade of about 1.3% at 20 km/h.
| Grade | km/h | Legs (W) | Air | Rolling | Gravity |
|---|---|---|---|---|---|
| 3% | 20 | 192 | 18% | 12% | 70% |
| 5% | 15 | 200 | 7% | 8% | 84% |
| 10% | 10 | 239 | 2% | 5% | 94% |
Shares are rounded. On this climb, total mass matters more than aerodynamic drag. At 5% and 15 km/h, 5 kg less total mass removes 11.6 W and CdA 0.25 removes 3.2 W. At 32 km/h on the flat those become 2.2 W and 31 W.
Head wind uses up nearly as much power as the ride itself
Take 32 km/h on the flat into a 15 km/h wind straight on the nose, a chosen example. Power rises by 164 W on a ride that needed 178 W. Drag follows speed through the air while the rider still covers ground at 32 km/h, and only the air term changes.
| Head wind (km/h) | W to hold 32 km/h | km/h if held at 178 W |
|---|---|---|
| 5 | 226 | 29.0 |
| 10 | 280 | 26.2 |
| 15 | 342 | 23.5 |
| 20 | 411 | 21.1 |
| 25 | 486 | 18.8 |
This is the best-supported line here: at CdA 0.27 the same wind still takes 156 W to 294 W, about 1.9 times. Out and back at a steady 178 W in a 10 km/h wind gives about 31 km/h overall, slower than still air.
To re-run these, enter rider 70, bike 10, speed 32, grade 0 and head wind 15 in our Cycling Power Calculator. Until the fix of 2 November 2026 it had no wind input and told readers to enter a higher speed instead. It also divided W/kg by total mass, so 281 W at 5% and 20 km/h read 3.52 where the rider-only figure is 4.02.
Wind entered as speed consumes power on paper only
Adding the wind to the speed treats our example as 47 km/h in still air, which reads 502 W against the true 342 W. Across winds of 5 to 25 km/h, this shortcut, our word for it, overstates by 16% to 78%. On a 5% climb at 15 km/h with the same wind it doubles the answer, 487 W against 244 W, because rolling and gravity get charged at the inflated speed too. With a 15 km/h tail wind it errs the other way, 40 W against 76 W.
A TrainerRoad forum thread from September 2024 asks why 20 km/h into a 20 km/h wind gave 186 W against 373 W for 40 km/h in still air. Our inputs give 161 W and 322 W, the same two to one: the forces match and ground speed halves.
Warm humid air claims about 4% less of a flat ride
We computed density with the CIPM-2007 formula at MSS and Hong Kong Observatory 1991–2020 normals. It is stated for 15–27 °C, so the two warm rows are slight extrapolations. MSS's page gives no pressure, so Singapore assumes 1013.25 hPa; Hong Kong uses the Observatory's.
| Condition | °C, RH | kg/m³ | W at 32 km/h |
|---|---|---|---|
| Textbook default | 15, dry | 1.225 | 178 |
| Hong Kong, January | 16.5, 74% | 1.221 | 177 |
| Singapore, mean of months | 27.8, 82% | 1.160 | 170 |
| Hong Kong, July | 28.9, 81% | 1.146 | 169 |
Singapore's air is 5.3% thinner than the default. Humidity alone lowers density only 1.1–1.2% there; temperature does the rest. Set against the wind's extra 164 W, 7.5 W is about one twenty-second, though 15 km/h exceeds MSS's mean monthly wind of 1.4–2.8 m/s (about 5–10 km/h), a station figure from Changi. At 5–10 km/h the wind still adds about 6 to 14 times as much. The comparison is in watts and says nothing about riding in heat.
Guessed drag and rolling figures take up most of the doubt
CdA is the largest unknown. In Defraeye and colleagues' wind tunnel work, one rider with bicycle measured 0.270 upright and 0.211 in a time-trial position. Crouch and colleagues' 2017 review tabulates upright values of 0.270–0.358 across three tunnel studies with static legs, which moves our flat figure from 156 W to 195 W. Our 0.32 sits inside that range and describes no reader.
For Crr we found no primary road-tyre figure to set beside 0.005, and ride data does not settle it: one 2021 preprint fits 0.00231 ± 0.00545 on a mainly flat course and 0.01298 ± 0.011 on a steady climb, on the same bike.
Martin's team reported a standard error of 2.7 W. That belongs to the fuller model in the study, which a later paper describes as including bearing friction and inertia. It does not transfer to a shorter sum fed with assumed inputs.

View author profile → · Editorial policy